NKE Stock Gains 1.66%, Momentum Weakens In Focus
On September 22, 2026: price 36.10 USD, trend downtrend, RSI 36.8, support 35.51, resistance 40.75. technical analysis of nke stock. NKE Stock Gains — full…

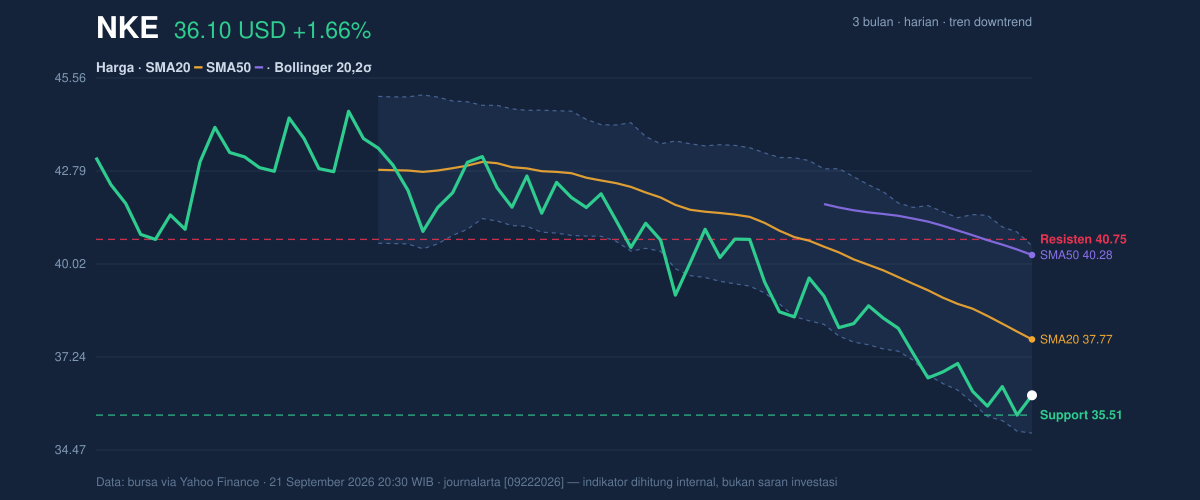
According to data from the New York Stock Exchange via Yahoo Finance, Nike (NKE) last traded at 36.10 USD, up 1.66% on the day after a weak stretch that still leaves the stock down 2.56% over 5 days and 11.43% over 1 month. The move matters less as a one-day bounce than as a test of whether buyers can defend a share price that sits close to the bottom of its recent range. As shown in the chart, Nike is still trading below its SMA20 at 37.77 and well below its SMA50 at 40.28, which keeps the broader message pointed downward even after today’s gain.
Trend & Price Action
The stock remains in a clear downtrend, with the SMA20 sloping down 2.73% over 5 days. That slope is important because it shows the short-term average itself is falling, not just the share price drifting below it. In plain terms, the market is still pricing in weaker momentum than it was a week ago. There is also no fresh MA-cross to suggest a trend reversal is underway, so the chart still lacks the kind of turning point traders usually want to see before calling a base. The last price is now only slightly above the 3-month low of 35.35, which means the stock is trading near the lower end of its recent range rather than in the middle of it.
The bounce is real, but the trend is not repaired.
That distinction matters because a one-session move above the previous close does not erase a month-long slide. The stock is still sitting 11% of the way up from the 20-hour support at 35.51 to the resistance at 40.75, which places it closer to support than to the ceiling. As shown in the chart, that positioning usually tells you the market is testing whether demand can hold the floor before it even thinks about challenging overhead supply.
Oscillators & Momentum
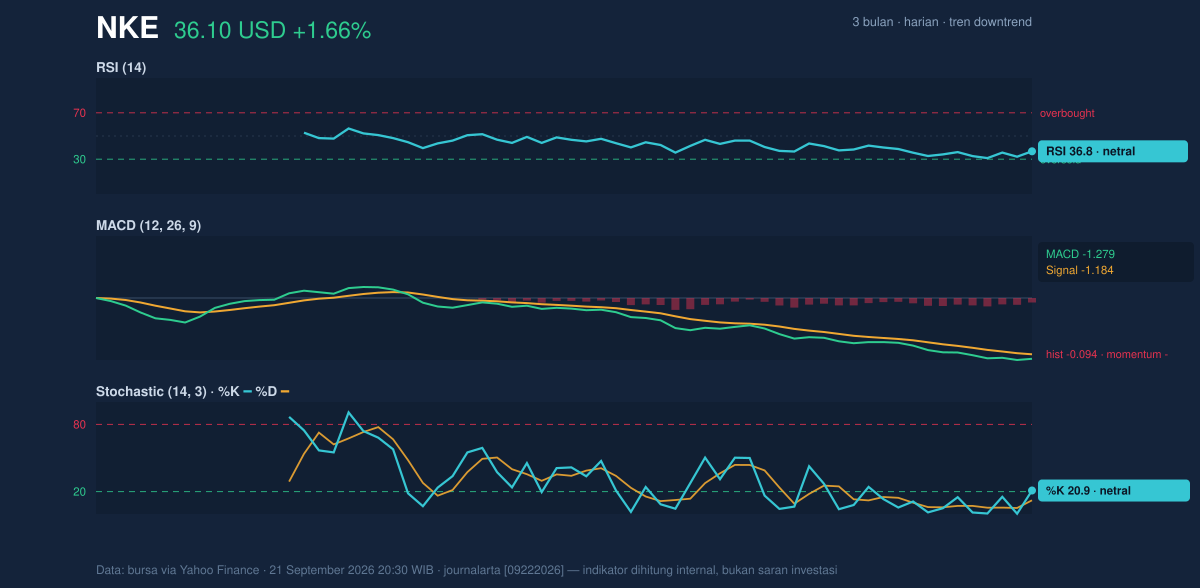
The oscillator picture is mixed, but not in a bullish way. RSI at 36.8 is technically neutral, yet it sits close to the lower end of the scale, which often signals a market that is weak but not yet fully oversold. The Stochastic %K at 20.9 and %D at 12.2 also reads as neutral, but the low levels show price is still pressing near the bottom of its recent trading band. In other words, momentum has not flipped positive; it is simply stretched enough that a pause or bounce is possible.
The more important message comes from the MACD at -1.279 versus signal -1.184, with a negative histogram of -0.094. MACD is a trend-following momentum gauge, and when it stays below its signal line, it usually means selling pressure still outweighs buying pressure. The histogram being negative but modest suggests the bearish impulse is still present, though not aggressively accelerating. That is a subtle difference: the stock is not collapsing, but it is also not building convincing upward momentum yet.
Momentum is weak, not washed out.
Volatility & Volume
Bollinger Bands help show whether the stock is stretched or compressed. Nike is trading near the lower half of its band structure, with %B at 20%, which means the price is closer to the lower band than the upper band. The bands themselves are not unusually tight, with 14.8% width described as normal, so this is not a squeeze setup that often precedes a sharp breakout. Instead, the chart suggests a market that is already under pressure but still has room to move if a catalyst appears. The lower Bollinger band at 34.97 is especially important because it sits just below current trading and lines up closely with the nearby support zone.
Volume adds another layer. The latest session saw 42,083,100 shares traded, about 1.3× normal versus the 20-day average of 31,714,645. Higher-than-average volume on a day when the stock rises can be constructive, because it means more participants were willing to engage. But the OBV is falling, and that is the more telling signal here: On-Balance Volume tracks whether volume is accumulating on up days or fading on down days. A declining OBV says the broader flow of money has not yet turned supportive, so the day’s bounce is not fully confirmed by participation.
Key Levels & Scenarios
The immediate map is fairly clear. Support sits at 35.51, with the 3-month low at 35.35 just beneath it. That makes the mid-35 area a critical defense zone. If that area fails, the chart would likely shift from “weak but stabilizing” to “renewed breakdown risk.” On the upside, resistance at 40.75 is the first major barrier, while SMA20 at 37.77 and SMA50 at 40.28 act as layered hurdles before that. Since the price is still below both moving averages, the stock would need to reclaim those levels before the trend damage begins to ease.
The burden of proof remains with the bulls.
Technical Verdict: HOLD (wait & see)
HOLD (wait & see) fits the current setup because the stock is still below SMA20 at 37.77 and SMA50 at 40.28, MACD remains negative, and OBV is falling, all of which point to an unhealed downtrend. At the same time, RSI at 36.8 and Stochastic at 20.9 / 12.2 show the stock is weak enough to bounce, while volume at 1.3× normal suggests traders are still active around the move.
- Ideal Entry Range: 35.51 to 37.77, using support and the SMA20 zone as the area where stabilization would need to appear.
- Exit Target: 40.28 to 40.75, based on the SMA50 and the 20-hour resistance.
- Stop Loss protection: below 35.35, the 3-month low and the nearest downside reference.
This is a stock that has stopped falling cleanly, but has not yet proved it can rise cleanly. The verdict is invalidated if price breaks below 35.35.
“Until the stock can reclaim its moving averages, the chart is still asking the same question: is this a pause, or the start of another leg down?”
Summary Data NKE
| Last price | 36.10 USD |
| Change 1 day / 5 days / 1 month | 1.66% / -2.56% / -11.43% |
| Trend / MA-cross | downtrend / none |
| SMA20 / SMA50 | 37.77 / 40.28 |
| RSI (14) / Stochastic %K | 36.8 / 20.9 |
| Bollinger %B / ATR | 20% / 0.90 |
| Support / Resistance 20 days | 35.51 / 40.75 |
| Data as of | 21 September 2026 20:30 WIB |


