OCBC Momentum Weakens: Stock Gains 0.92% (September 22, 2026)
On September 22, 2026: price 31.67 SGD, trend uptrend, RSI 57.8, support 30.90, resistance 32.27. technical analysis of ocbc stock. OCBC Momentum Weakens —…

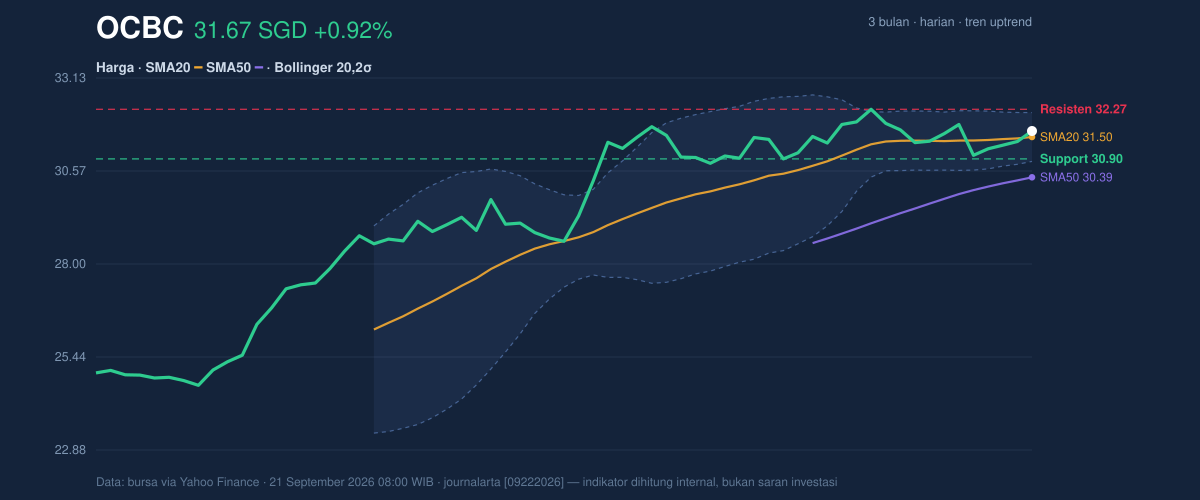
OCBC Bank’s shares rose to SGD 31.67 on SGX, up 0.92% from the previous close of 31.38, according to data from Yahoo Finance as of 21 September 2026 08:00 WIB. The move keeps the stock inside an established uptrend, but the tape is not yet showing the kind of force that usually accompanies a clean breakout. Price is holding above the SMA20 at 31.50 and well above the SMA50 at 30.39, which tells traders the medium-term structure is still constructive. At the same time, the latest MACD reading has slipped below its signal line, a reminder that momentum is not fully confirming the trend.
Trend & Price Action
The broader message from the chart is straightforward: OCBC is still trending higher, but it is doing so in a measured way rather than with aggressive follow-through. The price above the SMA20 and the much lower SMA50 show that recent buying has remained intact, while the lack of a fresh MA cross suggests the trend is mature rather than newly ignited. In plain terms, the stock is not trying to reverse; it is trying to extend a climb that has already been in place.
That matters because the current price sits in the upper half of the recent range, with the stock at about 56% of the way between the 20-hour support at 30.90 and the 20-hour resistance at 32.27. As shown in the chart, that positioning is consistent with a market that is being supported, but not yet decisively repriced. The three-month high at 32.57 is close enough to matter. A push through that area would signal that the market is willing to pay up for another leg higher; failure there would keep the stock confined to a range.
Oscillators & Momentum
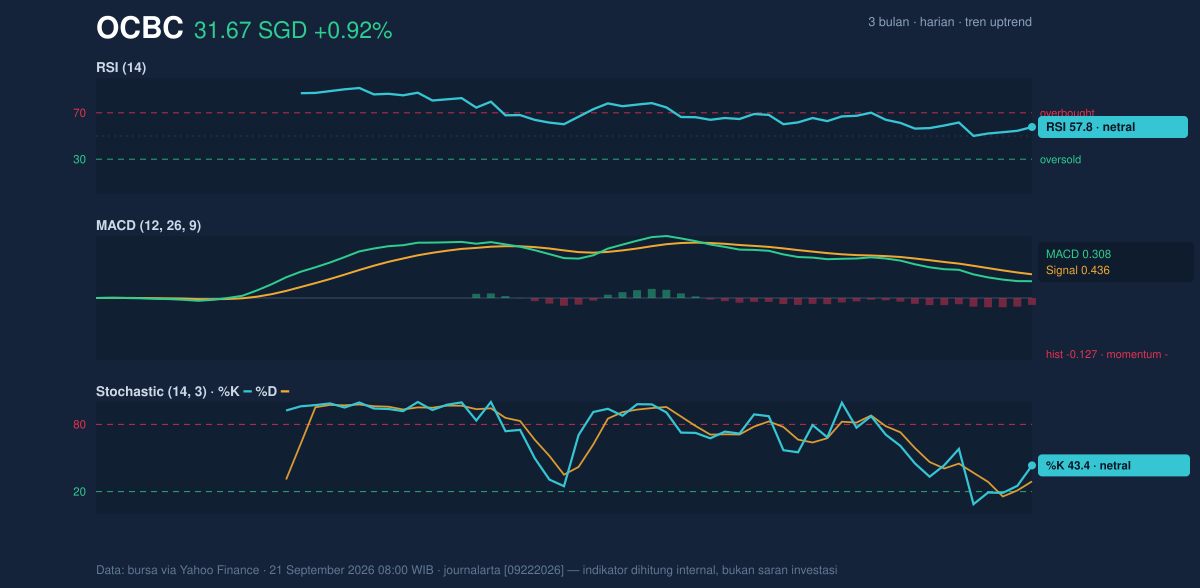
The oscillator picture is more balanced than the price trend. RSI at 57.8 is neutral-to-firm, which means the stock has room to advance without immediately looking stretched. It is not overbought, so the recent rise has not yet reached the kind of condition that often invites profit-taking. The Stochastic at 43.4 versus 29.1 also sits in neutral territory, and the %K line being above %D suggests short-term improvement, but not a strong impulse.
The more cautionary signal comes from MACD at 0.308, which remains positive in absolute terms but is still below the signal at 0.436, leaving the histogram at -0.127. That combination usually means the trend is still upward, yet the rate of ascent has slowed. In other words, the stock is advancing, but the internal momentum has cooled enough that the next move needs confirmation rather than assumption. As shown in the momentum chart, this is not a bearish reversal signal on its own; it is a warning that upside follow-through is not automatic.
Volatility & Volume
Volatility is moderate, with ATR(14) at 0.49, or about 1.6% of price. That tells readers the stock is not likely to make wild daily swings unless a catalyst arrives, but it can still move enough to test nearby support and resistance levels. The Bollinger Bands add an important layer: the upper band at 32.18, middle band at 31.50, and lower band at 30.83 are tightening, while the 4.3% band width points to a squeeze. A squeeze often means the market is compressing before a larger move, though the direction still needs confirmation.
The volume backdrop is less emphatic. Last volume of 4,613,774 was only 0.8x the 20-hour average of 5,769,552, so the latest rise did not arrive with strong participation. That tempers the bullish case. Still, OBV is rising, which is important: it suggests the broader flow of volume has been supportive even if the latest session was not especially heavy. In practical terms, the chart says buyers have been present, but not yet forceful enough to overpower nearby resistance decisively.
Key Levels & Scenarios
The immediate battleground is clear. Support at 30.90 is the first level that matters on the downside, with the Bollinger lower band at 30.83 reinforcing that zone. On the upside, resistance at 32.27 is the near-term ceiling, and the 3-month high at 32.57 is the next reference if that ceiling gives way.
If price can reclaim the area above 32.27 and then challenge 32.57, the squeeze in Bollinger Bands suggests the move could expand quickly. If instead the stock slips back below 31.50 and loses 30.90, the market would be signaling that the recent uptrend is losing traction and that the lower band near 30.83 is under pressure.
Technical Verdict: HOLD (wait & see)
The setup argues for HOLD (wait & see).
- Price remains above the SMA20 and SMA50, so the trend is still positive.
- MACD histogram is negative, showing momentum is lagging the price structure.
- Bollinger Bands are squeezing, which raises the odds of a breakout, but not its direction.
Verdict invalidated if price falls below 30.90, because that would break the nearest support and weaken the current uptrend structure.
- Ideal Entry Range: 30.90 to 31.50
- Exit Target: 32.27 to 32.57
- Stop Loss protection: below 30.83
For non-traders, this means OCBC still looks technically healthy, but the chart is waiting for proof that buyers can push the stock through resistance rather than just keep it afloat.
Summary Data OCBC
| Last price | 31.67 SGD |
| Change 1 day / 5 days / 1 month | 0.92% / -0.57% / 2.43% |
| Trend / MA-cross | uptrend / none |
| SMA20 / SMA50 | 31.50 / 30.39 |
| RSI (14) / Stochastic %K | 57.8 / 43.4 |
| Bollinger %B / ATR | 62% / 0.49 |
| Support / Resistance 20 days | 30.90 / 32.27 |
| Data as of | 21 September 2026 08:00 WIB |



