UOB Stock Technicals Today: Gains 0.77%, Testing Key Resistance
On September 22, 2026: price 42.10 SGD, trend sideways, RSI 55.0, support 40.64, resistance 42.33. technical analysis of uob stock. UOB Stock Technicals — full…

United Overseas Bank (UOB) on SGX edged up to SGD 42.10 in Singapore morning trade on 21 September 2026, after closing at 41.78, as the stock pushed higher inside a narrow band that has been tightening around the 20-day average. The move matters less for its size than for what it says about positioning: the shares are still trading above the short-term trend line, but they are now pressing against nearby resistance while broader momentum remains only moderately constructive.
Trend & Price Action
As shown in the chart, UOB is still in a sideways trend, and that is the central message from the price structure. The stock is above SMA20 at 41.47, which tells traders that the immediate trend has not broken down, but it remains just below SMA50 at 42.18, so the medium-term picture is not yet fully reclaimed. That gap is small, which usually signals a market that is testing direction rather than committing to one.
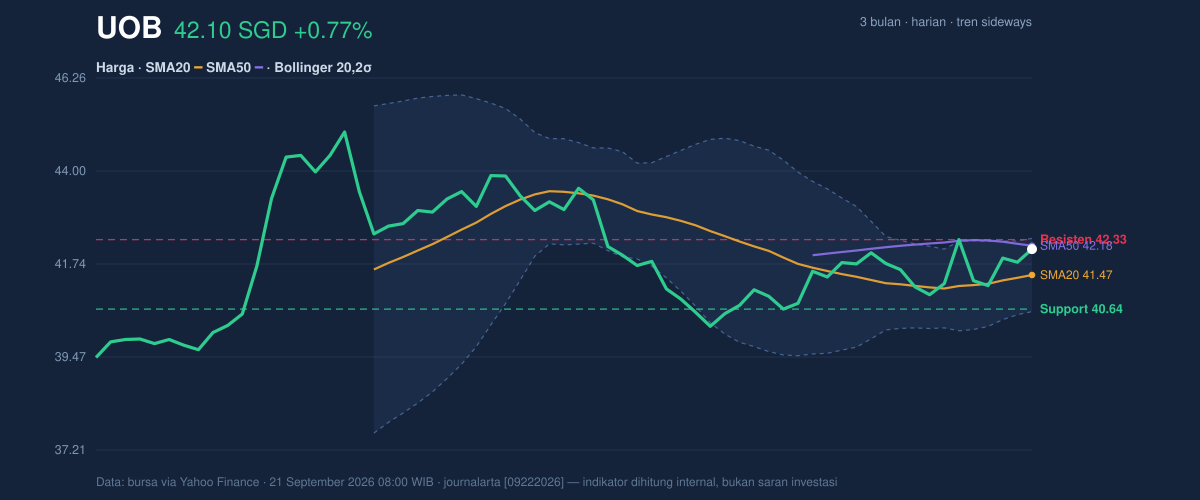
The lack of a fresh MA-cross reinforces that view. A moving-average cross is often read as a trend confirmation signal, and the absence of one here means the market has not produced a clean bullish or bearish shift. Price is also sitting at 86% of its 20-hour range, near the upper end of the recent band, which suggests buyers have been active but are now running into overhead supply close to resistance.
That supply is visible at SGD 42.33, while nearby support sits at SGD 40.64. In plain terms, the stock is trading close enough to resistance that the next move matters more than the current one: a firm break above the ceiling would strengthen the case for a broader range expansion, while failure there would keep the shares trapped in the same sideways pattern.
Oscillators & Momentum
The momentum readings are mixed, which is typical when a stock is moving sideways rather than trending cleanly. RSI at 55.0 is neutral, meaning the shares are neither stretched nor washed out. That matters because RSI is often used to gauge whether a move has become overdone; here, it says the rally has room left, but not much urgency.
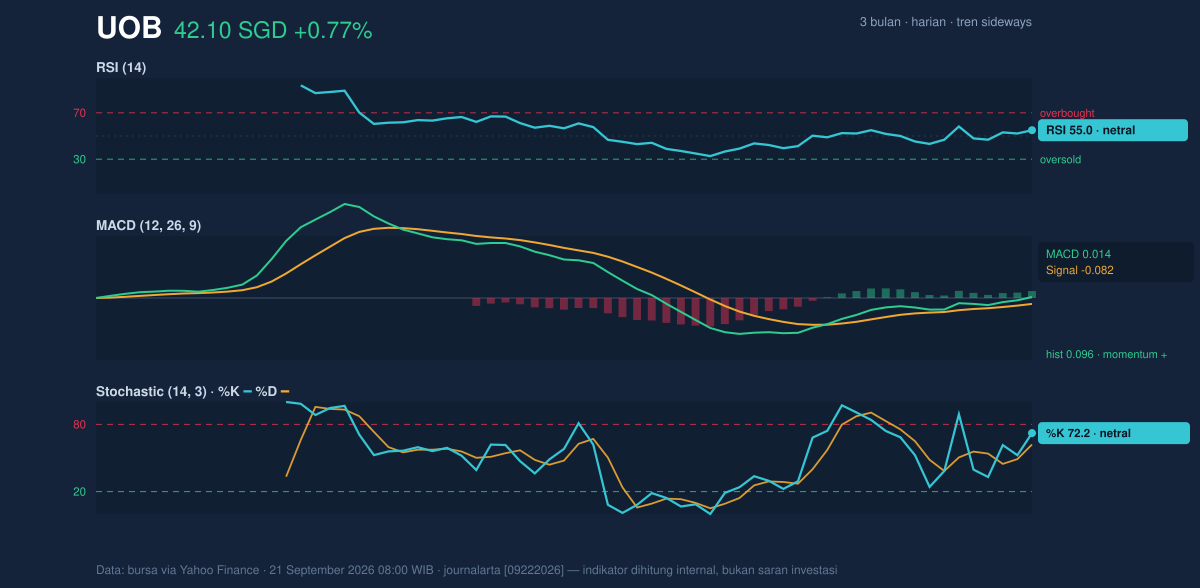
Stochastic is a little firmer, with %K at 72.2 and %D at 62.1. That places the stock in the upper half of its recent range and hints at short-term strength, but it is not a strong breakout reading on its own. The fact that the lines are elevated rather than deeply overbought means momentum is positive, though not yet explosive.
The sharper signal comes from MACD at 0.014, above its signal line at -0.082, with a histogram of 0.096. For general readers, MACD compares short- and medium-term price momentum; when it turns positive like this, it usually means the stock is gaining traction after a quieter phase. That aligns with the recent one-month gain of 3.36%, even if the five-day move is still slightly negative at -0.54%.
Volatility & Volume
Volatility is not elevated, but it is compressing. The Bollinger band width of 4.3% is narrowing, which often precedes a larger move because the stock has been coiling within a tighter range. With price near the upper band at SGD 42.36 and %B at 85%, UOB is spending most of its time near the top of that envelope, a sign of persistent demand, though not yet a decisive breakout.
The ATR of 0.64, or about 1.5% of price, points to moderate day-to-day movement. That is important because it suggests the stock can still move meaningfully without requiring a major market shock; a break from the current range could travel quickly once participation improves.
Volume, however, is only average. Last trade volume of 2,883,800 versus the 20-hour average of 2,798,508 is roughly 1.0x normal, so the latest price rise is not being backed by a clear surge in trading activity. The OBV is falling, and that is the cautionary note: on-balance volume tracks whether money is flowing into or out of a stock, and a declining line while price edges higher can mean buyers are not fully confirming the move.
Key Levels & Scenarios
The near-term map is straightforward. SGD 42.33 is the immediate barrier, and a clean move through that area would put the stock into a better technical position because it would clear both the recent range high and the upper edge of the current Bollinger structure. If that fails, the stock may continue to oscillate between resistance and the SGD 40.64 support zone, with the 20-day average at 41.47 acting as the pivot.
The broader context also matters. The 3-month high at 45.15 shows there is still room above if momentum improves, while the 3-month low at 39.20 marks the lower boundary of the recent recovery. That distance gives the chart a workable range, but it also shows that UOB is still well below the highs that would signal a more established uptrend.
Technical Verdict: HOLD (wait & see)
HOLD (wait & see) is the clearest reading from the current setup because the chart is constructive but not confirmed.
- MACD is positive, which supports improving short-term momentum.
- Price is above SMA20 and near the top of the recent range, showing buyers are active.
- Bollinger bands are squeezing, which raises the odds of a range break, but direction is not yet proven.
- Verdict invalidated if price breaks below SGD 40.64, because that would weaken the current support structure and the short-term recovery.
- Ideal entry range: SGD 41.47 to SGD 42.10
- Exit target: SGD 42.33, with scope toward the 3-month high at SGD 45.15 if resistance gives way
- Stop loss protection: below SGD 40.64
In plain English, the chart says UOB is holding up, but it still needs a stronger move above resistance before the next leg becomes convincing.
Summary Data UOB
| Last price | 42.10 SGD |
| Change 1 day / 5 days / 1 month | 0.77% / -0.54% / 3.36% |
| Trend / MA-cross | sideways / none |
| SMA20 / SMA50 | 41.47 / 42.18 |
| RSI (14) / Stochastic %K | 55.0 / 72.2 |
| Bollinger %B / ATR | 85% / 0.64 |
| Support / Resistance 20 days | 40.64 / 42.33 |
| Data as of | 21 September 2026 08:00 WIB |



