HD Stock Gains 1.79% Today, RSI Oversold
On September 23, 2026: price 305.35 USD, trend downtrend, RSI 27.1, support 297.20, resistance 337.88. technical analysis of hd stock. HD Stock Gains — full…

Home Depot shares rose 1.79% to 305.35 USD on the New York Stock Exchange, but the move sits inside a broader slide: the stock is still down 9.02% over the past month and remains below both its short- and medium-term trend lines, according to Yahoo Finance data as of 21 September 2026 20:30 WIB. That matters because a one-day rebound can mean very different things depending on where it happens. Here, the bounce is taking place after a decline, not after a base has been rebuilt — a sign that traders are testing whether the selling pressure is finally tiring, rather than proving it has ended.
Trend & Price Action
The chart shows Home Depot trading below the SMA20 at 316.56 and further beneath the SMA50 at 330.76, with the downtrend confirmed by the SMA20 slope of -2.80% over 5 days. In plain terms, the stock is still moving under its recent average price, which usually means rallies are being sold into before they can fully develop. There is also no fresh moving-average crossover, so the chart has not yet produced the kind of trend signal that would suggest a durable shift in direction. The price is sitting near the lower end of its recent range, with the 20-hour support at 297.20 not far below and the 20-hour resistance at 337.88 overhead.
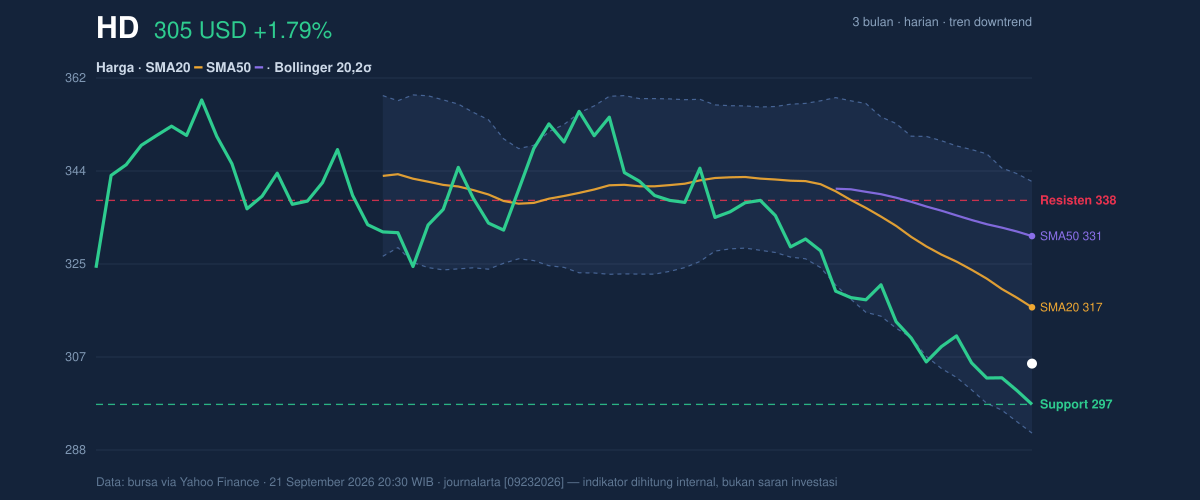
That placement is important: the stock is not breaking down through support, but it is also not reclaiming the averages that would show buyers have regained control.
Oscillators & Momentum
The momentum gauges are flashing a mixed message. RSI(14) at 27.1 and Stochastic %K at 5.8 with %D at 3.8 both sit in oversold territory, which often means the stock has fallen far enough, fast enough, that short-term selling may be stretched. But oversold does not automatically mean reversal. The MACD at -9.660, still below its signal line at -8.183, with a histogram of -1.477, says downward momentum is still active. In other words, Home Depot is technically “stretched” on the downside, yet the trend-following indicator has not turned up to confirm a recovery.
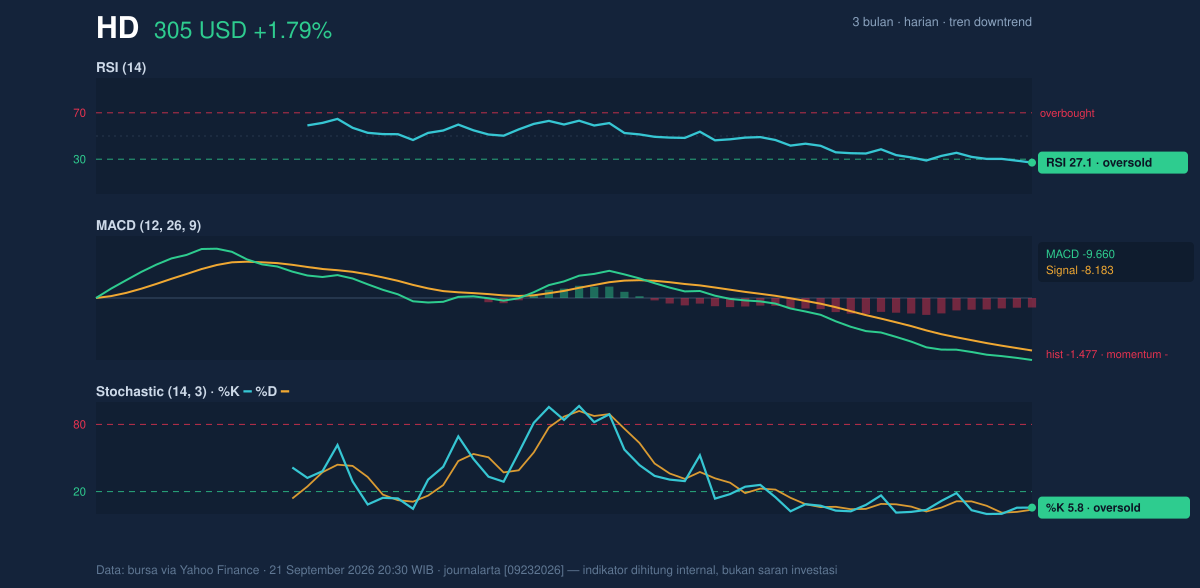
That split is the key signal: the stock is oversold, but not yet repaired.
Volatility & Volume
Volatility is present, but not extreme. The ATR(14) of 6.15, equal to 2.0% of price, suggests a normal trading environment rather than a panic move. Bollinger Bands reinforce that reading: the upper band is 341.64, the middle band is 316.56, and the lower band is 291.49, with %B at 28% and a 15.8% band width. %B near the lower part of the band means price is closer to the bottom of its recent volatility envelope than the top, which often reflects pressure rather than strength. Yet the band width is only normal, not compressed to an unusual degree, so this is not a classic “coiled spring” setup.
Volume adds a little credibility to the latest bounce. Trading volume of 5,434,300 was about 1.3× the 20-day average of 4,027,405, which shows participation improved on the session. Still, OBV is falling, and that is a caution flag: On-Balance Volume tracks whether money flow is building or leaking away, and a declining OBV means recent up days have not yet reversed the broader distribution pattern. The bounce has buyers, but not yet conviction.
Key Levels & Scenarios
The market is now leaning on a narrow technical corridor. The nearest support is 297.20, while the first major resistance is 337.88. The stock is also trading inside the lower part of its 3-month range of 295.39 to 358.85, which places it close to the floor of that band but not through it. That is a meaningful distinction: being near the low can attract bargain hunting, but staying above the low is what keeps the chart from turning into a fresh breakdown.
If the stock can move back above the 316.56 SMA20, it would begin to challenge the idea that the downtrend is still in force. If it then clears 337.88, the chart would show a stronger recovery attempt toward the upper part of the recent range. If instead price slips below 297.20, the oversold readings would lose much of their protective value, because momentum would be confirming further downside rather than exhaustion.
Technical Verdict: HOLD (wait & see)
HOLD (wait & see)
- RSI 27.1 and Stochastic 5.8/3.8 show the stock is oversold, but that alone does not confirm a reversal.
- MACD -9.660 below signal -8.183 still points to negative momentum, so the trend has not turned.
- Price below SMA20 316.56 and SMA50 330.76, with OBV falling, means the rebound lacks full technical confirmation.
- Verdict invalidated if price breaks below 297.20.
- Ideal Entry Range: 297.20 to 305.35
- Exit Target: 316.56, then 337.88
- Stop Loss protection: below 297.20
For non-traders: the chart says Home Depot is stretched enough to bounce, but not yet strong enough to prove the downtrend has ended.
The next technical test is whether the shares can reclaim 316.56 while holding above 297.20.
Summary Data HD
| Last price | 305.35 USD |
| Change 1 day / 5 days / 1 month | 1.79% / -1.78% / -9.02% |
| Trend / MA-cross | downtrend / none |
| SMA20 / SMA50 | 316.56 / 330.76 |
| RSI (14) / Stochastic %K | 27.1 / 5.8 |
| Bollinger %B / ATR | 28% / 6.15 |
| Support / Resistance 20 days | 297.20 / 337.88 |
| Data as of | 21 September 2026 20:30 WIB |


