INTC Stock Gains 14.05% Today, RSI Overbought
On September 23, 2026: price 123.86 USD, trend uptrend, RSI 70.6, support 87.26, resistance 121.78. technical analysis of intc stock. INTC Stock Gains — full…

Intel is trading at a level that matters far beyond Wall Street: the stock has moved from recovery mode into a stretched advance, and the chart now says the market is testing how far momentum can run before it cools.
Intel’s shares on NASDAQ closed at 123.86 USD, up 14.05% in one day, after a 27.44% gain over five days and a 37.52% rise over one month, according to the exchange data cited in Yahoo Finance. That pace matters because it is not just a bounce; it is a repricing that has pushed the stock well beyond its recent trading band. The move also leaves the shares near the upper end of the recent range, with the latest price sitting above the 20-day moving average at 97.45 and the 50-day moving average at 97.33, a setup that confirms the trend has turned decisively upward.
Trend & Price Action
The most important signal in the chart is the golden cross, where the SMA20 has moved above the SMA50. In plain language, shorter-term price strength has overtaken the slower trend line, which usually tells traders that momentum has shifted in favor of the bulls. The slope of the SMA20 is rising at 3.30% over five days, reinforcing that this is not a flat consolidation but an accelerating trend.
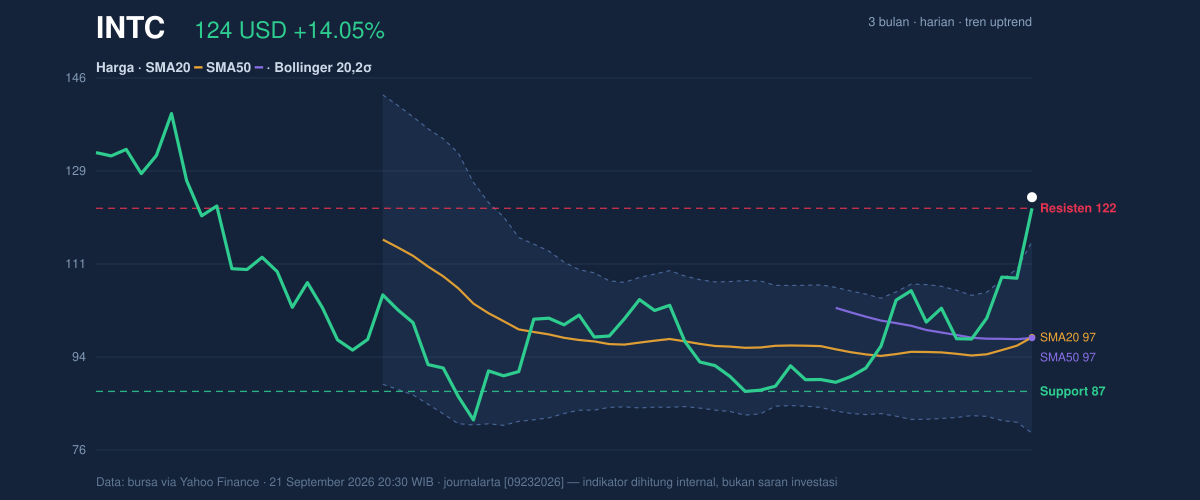
The price is also trading above the upper Bollinger Band at 115.51, with %B at 123%. That means Intel is not merely near the top of its recent volatility envelope; it is trading beyond it. In technical terms, that often signals a strong breakout, but it also warns that the move is extended and vulnerable to profit-taking. The Bollinger band width of 37.0% shows the range has expanded sharply, which usually happens when a stock is being actively repriced rather than drifting.
The broader structure supports that reading. Intel is now above the 20-hour support at 87.26 and above the 20-hour resistance at 121.78, with the latest price sitting at 106% of the range. That is a rare position: the stock has already moved through the ceiling that had capped recent trading, so the next question is not whether momentum exists, but whether it can hold its gains after such a vertical move.
Oscillators & Momentum
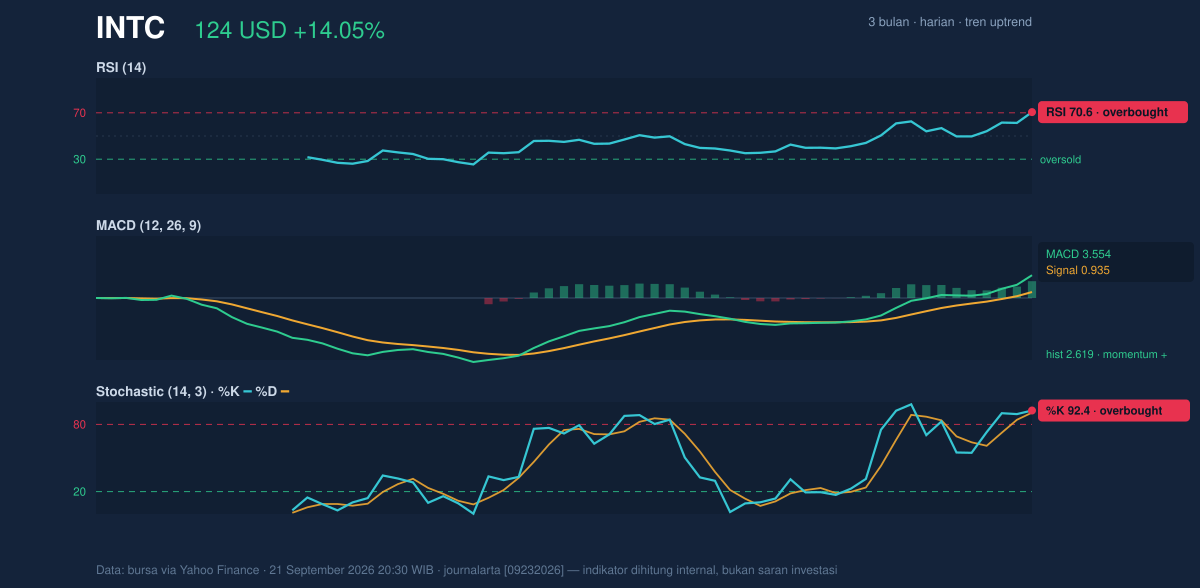
Momentum indicators are aligned, but they are also stretched. The RSI at 70.6 is in overbought territory, which does not mean a reversal is guaranteed; it means the stock has risen so quickly that it may be due for a pause, consolidation, or a sharper pullback if buyers step back. The Stochastic oscillator at 92.4 / 90.5 tells the same story. Stochastic measures where the price sits within its recent range, and readings this high usually indicate the stock is pressing against the upper edge of that range with limited room for immediate extension.
The MACD at 3.554, above its signal line at 0.935 with a histogram of 2.619, is the clearest proof that upside momentum is still active. MACD is a trend-following indicator, so a positive spread like this means the recent rally has enough force to remain intact for now. The key nuance is that momentum and stretch are both true at the same time: the trend is strong, but the stock is also technically overheated.
Volatility & Volume
Volatility is confirming the move rather than contradicting it. The ATR at 6.54, equal to 5.3% of price, shows that daily swings have widened materially. That matters because a stock with a high ATR can move several dollars in either direction without changing the broader trend. For Intel, this increases the odds of sharp intraday reversals even while the larger trend remains upward.
Volume gives the rally more credibility. The latest volume of 191,638,400 is about 1.9× the 20-hour average of 102,915,410, and OBV is rising. OBV, or on-balance volume, tracks whether volume is flowing in with price advances; a rising OBV suggests the rally is being backed by participation rather than a thin, easily reversed move. As shown in the chart, that combination usually strengthens the case that the breakout is real, even if it is extended.
Key Levels & Scenarios
The nearest technical reference points now sit below the market. The most important support remains the 20-hour support at 87.26, while the former ceiling at 121.78 has become the first level to watch on any pullback. Because the stock is already above the upper Bollinger Band at 115.51, a retreat toward that area would not automatically damage the trend; it would more likely suggest the market is normalizing after an overheated run.
The 3-month range adds context. Intel has traded between a 3-month low of 81.79 and a 3-month high of 142.35. That places the current price well above the midpoint and closer to the upper half of the range, but still below the peak. If the stock holds above 121.78, the chart remains in breakout mode. If it slips back below that level and fails to stabilize near the upper Bollinger Band at 115.51, the move starts to look more like exhaustion than continuation.
Technical Verdict: HOLD (wait & see)
The chart is bullish, but it is also extended, which is why the technical stance is HOLD (wait & see).
Reasons:
- Golden cross and price above both SMA20 at 97.45 and SMA50 at 97.33 confirm a strong uptrend.
- MACD is positive and the OBV is rising, showing momentum is supported by participation.
- RSI at 70.6, Stochastic at 92.4/90.5, and %B at 123% all warn the move is stretched.
Verdict invalidated if price breaks below 115.51, because that would mean the stock has fallen back inside the Bollinger envelope after trading above it.
- Ideal Entry Range: 115.51 to 121.78
- Exit Target (Target Price): 142.35
- Stop Loss protection: 97.45
For non-traders: Intel’s trend is strong, but the stock has already run hard enough that patience matters more than chasing the move.
The latest volume was 191,638,400.
Summary Data INTC
| Last price | 123.86 USD |
| Change 1 day / 5 days / 1 month | 14.05% / 27.44% / 37.52% |
| Trend / MA-cross | uptrend / golden |
| SMA20 / SMA50 | 97.45 / 97.33 |
| RSI (14) / Stochastic %K | 70.6 / 92.4 |
| Bollinger %B / ATR | 123% / 6.54 |
| Support / Resistance 20 days | 87.26 / 121.78 |
| Data as of | 21 September 2026 20:30 WIB |


