Momentum Weakens, NKE Stock Gains 1.66% Today
On September 23, 2026: price 36.10 USD, trend downtrend, RSI 37.0, support 35.51, resistance 40.75. technical analysis of nke stock. Momentum Weakens — full…

Nike’s shares rose 1.66% to 36.10 USD on the latest session, according to Yahoo Finance data cited in the market feed, but the rebound sits inside a larger slide: the stock is still down 11.43% over the past month and remains well below both its SMA20 at 37.77 and SMA50 at 40.28. That combination matters because it shows the move is more of a bounce within a falling trend than a confirmed reversal. In plain terms, buyers showed up for a day, but they have not yet changed the direction of the tape.
Trend & Price Action
The chart shows Nike trading in a clear downtrend, with the SMA20 slope down 2.73% over five days. A falling short-term average means recent prices are still weakening faster than they are recovering, and the fact that price is below the SMA20 tells us the stock has not reclaimed even the first layer of trend support. The longer SMA50 at 40.28 sits even higher, reinforcing that the share price is trading under both near- and medium-term trend markers.
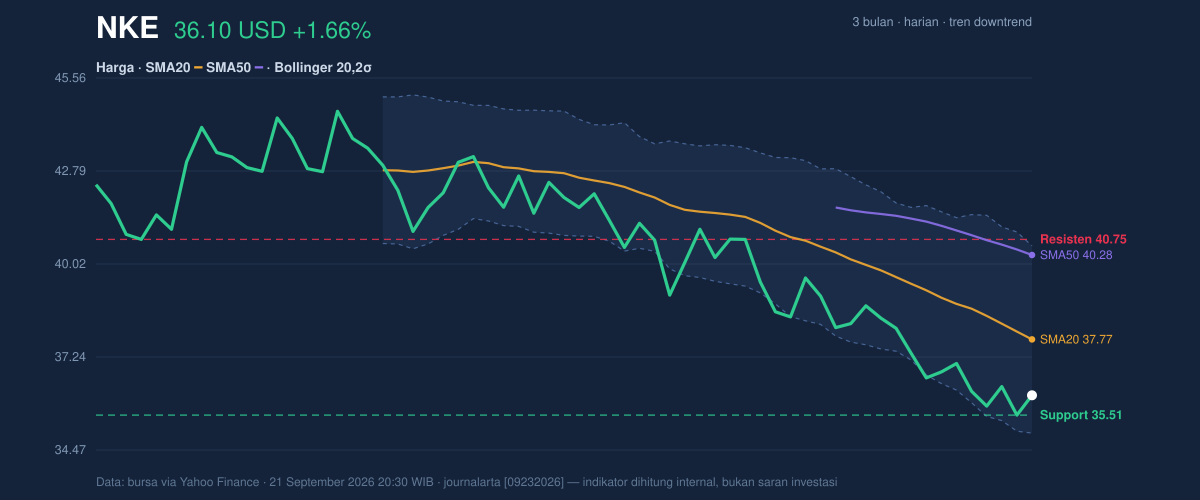
The position within the range also leans cautious. With price near 36.10, Nike is sitting only about 11% of the way up from the 20-hour support at 35.51 to the 20-hour resistance at 40.75. That is not a bullish location; it means the stock is closer to the floor than the ceiling, and any failure to hold the lower end of the range could expose the recent 3-month low of 35.35. By contrast, reclaiming the mid-band around 37.77 would be the first sign that the market is trying to stabilize rather than merely bounce.
The absence of a fresh MA-cross also matters. There is no new moving-average crossover to suggest a trend change, so the chart is still waiting for confirmation rather than offering it.
Oscillators & Momentum
Momentum indicators are not screaming panic, but they are not confirming strength either. The RSI at 37.0 is in neutral territory, which means the stock is not technically oversold yet; it is weak, but not washed out. That distinction matters because a neutral RSI in a downtrend often signals the market still has room to drift lower before bargain-hunting becomes more compelling.
The stochastic oscillator is similarly mixed. The %K at 20.9 and %D at 12.2 sit in a low zone that often reflects fading momentum, but the pair is still being described as neutral because it has not produced a decisive reversal signal. In other words, the stock is not showing the kind of clean upward turn that would usually mark the start of a new push higher.
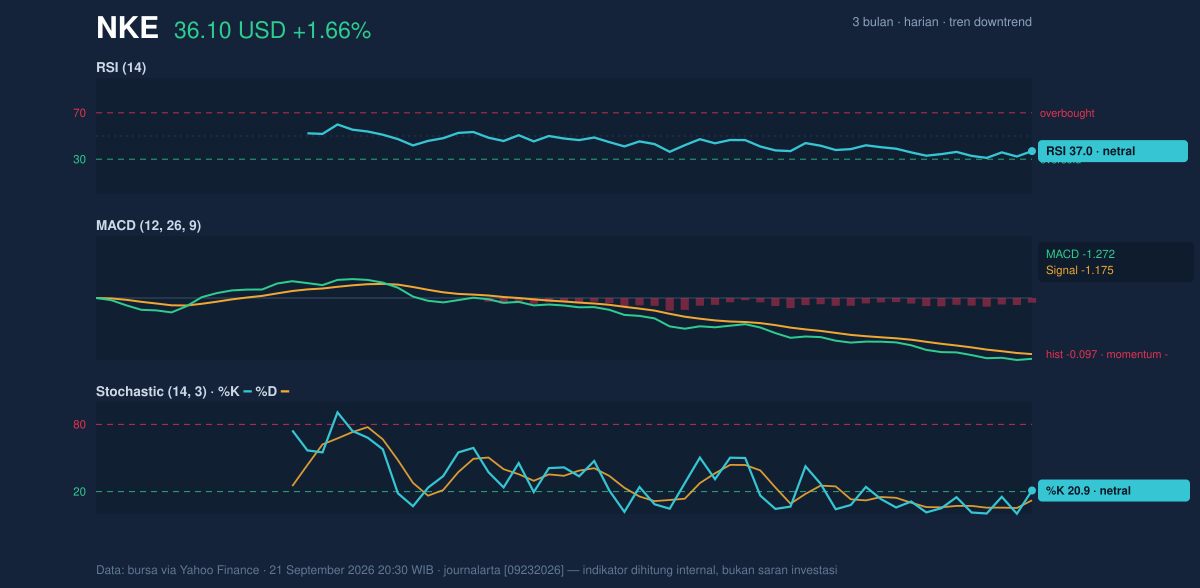
The more important warning comes from the MACD at -1.272, sitting below its signal line at -1.175 with a histogram of -0.097. MACD measures trend momentum, and a negative reading below the signal line means the downtrend still has the edge. The histogram being slightly negative says that bearish momentum is not accelerating sharply, but it is still leaning against the stock.
Volatility & Volume
Volatility is moderate, not extreme. The ATR(14) at 0.90, equal to 2.5% of price, suggests the stock can move with enough daily range to test nearby support or resistance, but not so violently that every session looks like a breakdown. The Bollinger Bands help frame that behavior: the upper band is 40.56, the middle band is 37.77, and the lower band is 34.97. With %B at 20%, price is sitting near the lower part of the band structure, which usually means the stock is trading closer to the lower boundary than the upper one.
That is a soft warning, not a crash signal. The band width at 14.8% is normal, so this is not a squeeze setting up an explosive move. It is more consistent with a stock that is already trending and still searching for a base. Volume adds a small but useful clue: the latest session’s 42,128,800 shares were about 1.3x the 20-day average of 31,716,930, showing participation in the rebound. Yet OBV is down, which means the broader volume flow has not turned supportive; more shares trading on a down-biased cumulative pattern usually signals distribution rather than accumulation.
Key Levels & Scenarios
The market is now defined by a tight set of levels. 35.51 is the nearest support, and 35.35 is the 3-month low that matters as the next downside reference. If that floor fails, the chart would be signaling that the recent rebound was only a pause in the decline. On the upside, 37.77 is the first checkpoint, because it matches the Bollinger middle band and SMA20, while 40.75 and 40.56 frame the next resistance zone around the upper band and range ceiling.
If price can hold above 35.51 and recover 37.77, the chart would start to look less fragile. If it loses 35.35, the tone turns much more defensive.
Technical Verdict: HOLD (wait & see)
HOLD (wait & see)
- MACD remains negative, with the line below the signal line, so downside momentum has not fully cleared.
- Price is below SMA20 and SMA50, and the SMA20 is still sloping lower, which keeps the trend bearish.
- Volume was above average, but OBV is down, so the rebound lacks convincing accumulation.
Verdict invalidated if price falls below 35.35.
- Ideal entry range: 35.51 to 37.77
- Exit target: 40.56 to 40.75
- Stop loss protection: below 35.35
For non-traders, this means the stock is trying to stabilize, but the chart has not yet proven that the decline is over.
“Right now, the market is asking Nike to prove it can hold the floor.”
Summary Data NKE
| Last price | 36.10 USD |
| Change 1 day / 5 days / 1 month | 1.66% / -2.56% / -11.43% |
| Trend / MA-cross | downtrend / none |
| SMA20 / SMA50 | 37.77 / 40.28 |
| RSI (14) / Stochastic %K | 37.0 / 20.9 |
| Bollinger %B / ATR | 20% / 0.90 |
| Support / Resistance 20 days | 35.51 / 40.75 |
| Data as of | 21 September 2026 20:30 WIB |


