MRK Stock Analysis: Gains 2.75%, Momentum Weakens
On September 23, 2026: price 150.91 USD, trend sideways, RSI 60.0, support 143.79, resistance 156.45. technical analysis of mrk stock. MRK Stock Analysis —…

Merck is trying to hold a constructive longer-term base, but the latest tape shows the stock still needs confirmation: MRK last traded at 150.91 USD, up 2.75% on the day, yet the broader message from momentum and volume is mixed rather than decisively bullish.
Trend & Price Action
As shown in the chart, Merck is trading above its SMA20 at 148.59 and well above its SMA50 at 138.39, which tells investors the medium-term structure remains intact even though the stock has not broken into a clean acceleration phase. The absence of a new MA-cross means there is no fresh moving-average signal to mark a regime change; instead, the setup still looks like a sideways consolidation with a mild upward bias, reinforced by the 0.25%/5 days SMA20 slope. In plain terms, the trend is not weak, but it is not yet forceful.
The price is also sitting in the upper half of its recent range: the 20-hour support at 143.79 and 20-hour resistance at 156.45 frame the current move, with the stock positioned around 56% of the range. That matters because it shows buyers have kept the share price above the midpoint, but they have not yet forced a breakout through overhead supply. The broader 3-month high of 156.92 is close enough to act as a real test, not a distant milestone.
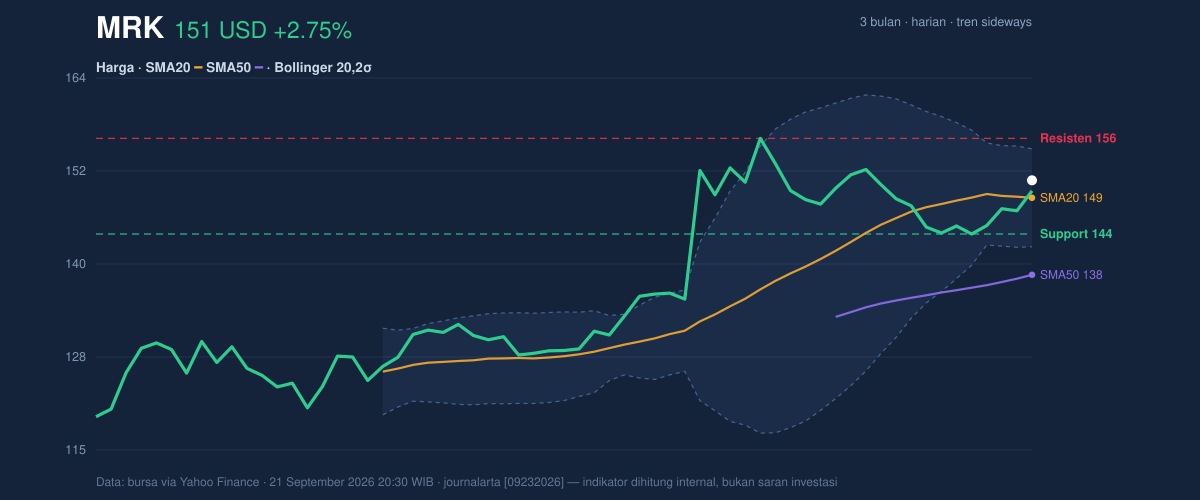
The chart’s message is straightforward: Merck is holding a base, but the market is still asking for proof.
Oscillators & Momentum
Momentum is where the story becomes more nuanced. RSI at 60.0 sits in neutral territory, which suggests the stock is neither stretched nor washed out. That is usually a healthy place for a stock to be if a trend is building, but it does not itself confirm one. The Stochastic %K at 68.5 and %D at 52.7 also read as neutral, with %K above %D indicating some near-term lift, though not enough to describe the move as fully energized.
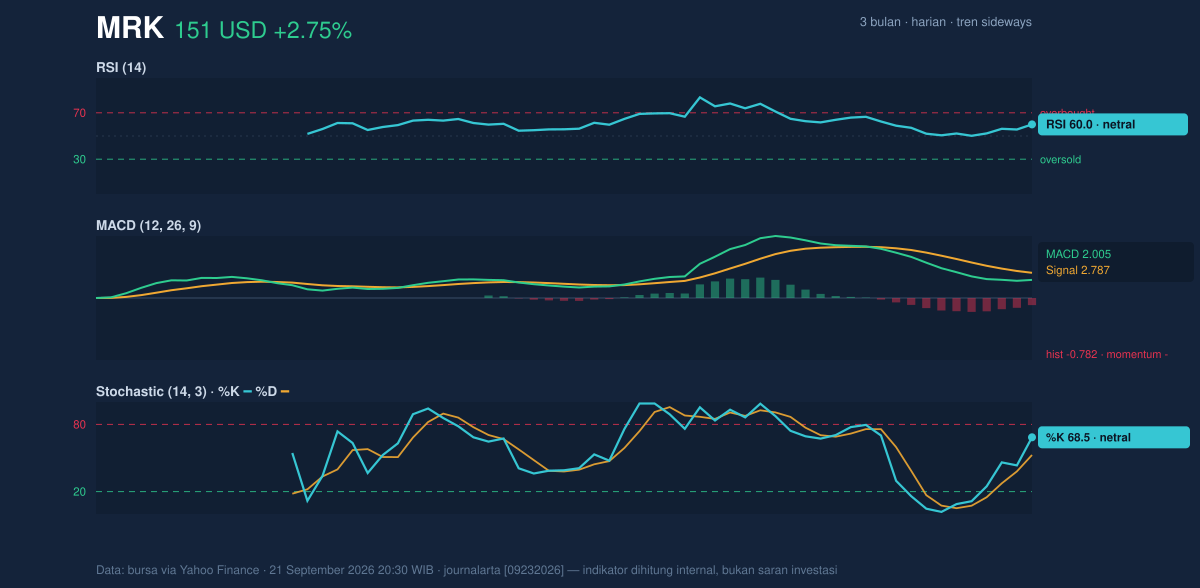
The more important signal is the MACD at 2.005 versus signal at 2.787, leaving a -0.782 histogram. For general readers, MACD compares short- and medium-term price momentum; when it sits below its signal line, it means the recent push is losing some force even if price has not rolled over. That is the key tension here: price is above major averages, but momentum is not yet confirming a strong continuation. In other words, the stock is climbing, but the climb is still under review.
Volatility & Volume
Volatility is contained rather than explosive. The ATR(14) of 3.01, equal to about 2.0% of price, points to moderate daily movement. That usually means traders are not pricing in a disorderly swing, but it also means a breakout would need meaningful participation to be durable. The Bollinger Band structure supports that reading: price is above the middle band at 148.59, with the upper band at 155.07 and lower band at 142.10. The %B at 68% shows the share is leaning toward the upper half of the envelope, but not pressing the top edge. The 8.7% band width is normal, so this is not a squeeze setup that often precedes a sharp expansion.
Volume is the biggest caution flag. Last session volume was 7,992,700, below the 20-day average of 10,210,235, or 0.8x normal. That means the advance came without full market participation. The OBV is down, which is especially important because on-balance volume tracks whether money flow is supporting the price trend. When price rises but OBV falls, the move can reflect limited conviction rather than broad accumulation. Put simply: the stock moved up, but the crowd did not fully join in.
Key Levels & Scenarios
The nearest technical map is clear. Support at 143.79 is the first level that needs to hold if the recent rise is to stay credible. Below that, the Bollinger lower band at 142.10 becomes the next important reference, because a move through it would suggest the stock is losing its current balance. On the upside, resistance at 156.45 lines up closely with the 3-month high at 156.92 and the Bollinger upper band at 155.07, creating a tight ceiling zone.
If MRK can push through that ceiling with stronger volume, the chart would shift from consolidation to breakout attempt. If it fails there, the current move remains just a recovery inside a sideways range. The signal is not ambiguous; the market is waiting for confirmation.
Technical Verdict: HOLD (wait & see)
HOLD (wait & see)
- Reason 1: Price is above SMA20 at 148.59 and SMA50 at 138.39, so the broader structure is still supportive.
- Reason 2: MACD is negative versus its signal line, which means short-term momentum is not fully confirming the price rise.
- Reason 3: Volume is only 0.8x normal and OBV is down, so the latest advance lacks strong participation.
- Verdict invalidated if price breaks below 143.79, because that would damage the current range structure and expose the 142.10 band area.
- Ideal Entry Range: 148.59 to 143.79, where the stock sits near its middle band and first support.
- Exit Target: 155.07 to 156.45, the Bollinger upper band and resistance zone.
- Stop Loss protection: below 142.10, where the Bollinger lower band would indicate the range is failing.
For non-traders, this means Merck is holding up, but it has not yet shown enough momentum and volume to prove the move is real.
The next technical test is whether MRK can challenge 156.45 and the 156.92 three-month high.
Summary Data MRK
| Last price | 150.91 USD |
| Change 1 day / 5 days / 1 month | 2.75% / 4.18% / -1.08% |
| Trend / MA-cross | sideways / none |
| SMA20 / SMA50 | 148.59 / 138.39 |
| RSI (14) / Stochastic %K | 60.0 / 68.5 |
| Bollinger %B / ATR | 68% / 3.01 |
| Support / Resistance 20 days | 143.79 / 156.45 |
| Data as of | 21 September 2026 20:30 WIB |


