WMT Testing Key Resistance: Stock Gains 3.18% (September 23, 2026)
On September 23, 2026: price 110.12 USD, trend sideways, RSI 48.0, support 102.63, resistance 109.08. technical analysis of wmt stock. WMT Testing Key…

Walmart’s shares are pressing into the upper edge of their recent trading range, a sign that the market is testing whether a cautious, sideways pattern can turn into something stronger. On the NYSE, WMT last traded at 110.12 USD, up 3.18% on the day and 6.19% over the past month, but the price is now sitting above a resistance zone that has already been approached repeatedly, which makes the next move more important than the last one.
Trend & Price Action
The broader message from the chart is not a clean uptrend, but a market that is trying to improve from inside a range. As shown in the chart, price is above the SMA20 at 106.24 and also slightly above the SMA50 at 109.78, which is constructive because it means the stock has recovered enough to reclaim both short- and medium-term trend markers. At the same time, the SMA20 slope is still negative at -0.69% over 5 days, so the shorter trend has not fully flipped higher yet.
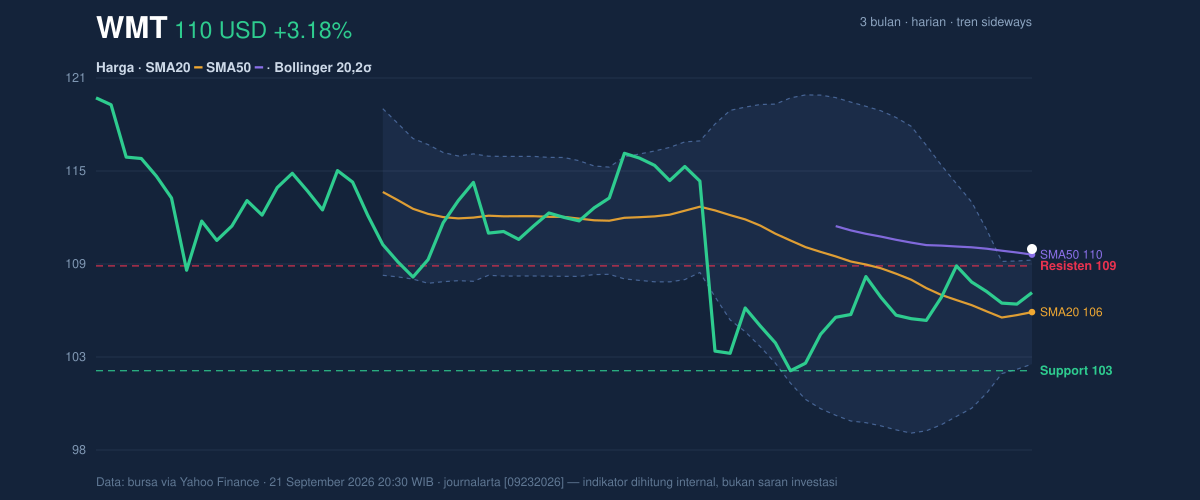
That tension matters. A stock can trade above its moving averages while still lacking a decisive trend if those averages are flattening or falling, and that is the case here. The lack of a new MA-cross tells the same story: there is no fresh technical crossover to confirm a stronger regime change. The price is also at 116% of the 20-hour range, which means it is pushing beyond the recent upper boundary rather than comfortably cruising through the middle. In plain terms, the market is leaning bullish, but it is doing so at a level where traders usually want proof.
The broader range adds context. The 3-month high is 120.40 and the 3-month low is 102.15, placing the current price closer to the upper half of that span. That is a healthier position than being stuck near the lows, yet it also leaves room for the move to stall if buyers cannot sustain the push above nearby resistance.
Oscillators & Momentum
The momentum tools are mostly neutral, which is important because they do not fully validate the recent price strength. RSI(14) is 48.0, a reading that sits in the middle of the scale and suggests neither overbought enthusiasm nor oversold distress. In practical terms, RSI at this level says the stock has not become stretched, but it also has not generated the kind of momentum that usually accompanies a durable breakout.
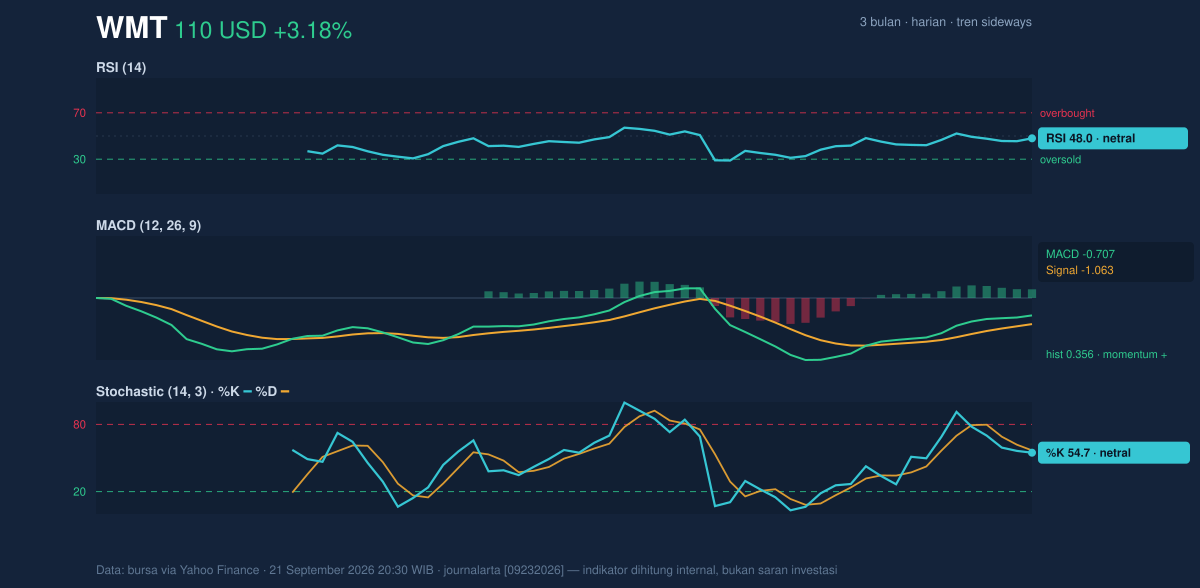
The Stochastic %K at 54.7 and %D at 56.8 are similarly balanced. When these lines cluster around the middle, they often point to a market that is still deciding direction rather than one already committed to a move. The more encouraging signal comes from MACD: MACD is -0.707 versus a signal line of -1.063, with a positive histogram of 0.356. That configuration means downside momentum is easing and the shorter-term line has moved above its signal line, a classic sign that the stock’s internal momentum is improving even if the broader trend has not yet fully turned.
This is the key nuance: the stock is not overextended, and momentum is improving, but the improvement is still modest enough to need confirmation from price. That is why the technical picture reads as a recovery attempt rather than a completed breakout.
Volatility & Volume
Volatility is moderate, which leaves room for movement without suggesting panic. ATR(14) is 1.75, or 1.6% of price, indicating a normal trading environment rather than a disorderly one. That matters because a market with moderate ATR can still move sharply if it is sitting near a band edge or resistance level, and Walmart is doing exactly that.
The Bollinger Bands sharpen the message. The upper band is 109.44, the middle band is 106.24, and the lower band is 103.04, while %B is 111%. A reading above 100% means price is trading beyond the upper band, which often reflects short-term strength but can also signal that the move is extended relative to its recent average. The band width is 6.0% and is squeezing, which is the important part: narrow bands often precede a larger move, but they do not tell direction by themselves. In other words, the market is coiling.
Volume does not yet provide a full confirmation. Last volume was 23,966,900, very close to the 20-hour average of 24,352,840, so the move is happening at roughly normal participation rather than with a surge of conviction. The OBV is falling, which is a caution flag because on-balance volume tracks whether buying pressure is accumulating over time. If price rises while OBV falls, the advance may be more fragile than it looks on the chart.
Key Levels & Scenarios
The market is now trading between nearby support and resistance that should frame the next session or two. The 20-hour support is 102.63, while 20-hour resistance is 109.08. Since the current price is above that resistance marker, the immediate question is whether the breakout attempt can hold or whether it slips back into the prior range. The upper Bollinger band at 109.44 sits close to that resistance, reinforcing the idea that the stock is testing a technical ceiling.
If the price can stay above the resistance zone and keep momentum aligned, the chart would start to look like a breakout from a squeeze. If it fails to hold above the recent ceiling, the move can easily revert toward the mid-band at 106.24 and then toward the lower band at 103.04. The lower boundary of the recent range at 102.63 is the key line that would show the attempt has lost traction.
Technical Verdict: HOLD (wait & see)
HOLD (wait & see)
- RSI at 48.0 and Stochastic %K/%D at 54.7/56.8 are neutral, so momentum is not strong enough to confirm a clean trend change.
- MACD is improving with a positive histogram of 0.356, but OBV is falling, which weakens the case for a fully supported breakout.
- Bollinger Bands are squeezing and price is above the upper band, which suggests potential expansion, but the move still needs confirmation above resistance.
- Invalidation condition: this verdict is invalidated if price falls below 102.63, where the recent support structure would break.
- Ideal Entry Range: 106.24 to 109.08
- Exit Target: 109.44 to 120.40
- Stop Loss protection level: 102.63
For non-traders, that means Walmart is showing improvement, but the chart still needs proof that the recent strength is real rather than just a brief push. The next technical test is whether the stock can hold above 109.08 and remain there into the next session.
Summary Data WMT
| Last price | 110.12 USD |
| Change 1 day / 5 days / 1 month | 3.18% / 0.95% / 6.19% |
| Trend / MA-cross | sideways / none |
| SMA20 / SMA50 | 106.24 / 109.78 |
| RSI (14) / Stochastic %K | 48.0 / 54.7 |
| Bollinger %B / ATR | 111% / 1.75 |
| Support / Resistance 20 days | 102.63 / 109.08 |
| Data as of | 21 September 2026 20:30 WIB |

