OCBC Stock Drops 1.52%, Momentum Weakens In Focus
On September 24, 2026: price 31.65 SGD, trend uptrend, RSI 55.5, support 30.90, resistance 32.27. technical analysis of ocbc stock. OCBC Stock Drops — full…

OCBC Bank slipped to 31.65 SGD in the latest Singapore trading session, down 1.52% from the previous close of 32.14, but the move sits inside a still-intact uptrend rather than a clear trend break. As shown in the chart, the share price remains above both the SMA20 at 31.55 and the SMA50 at 30.56, which tells traders the medium-term structure is still constructive even after a day of profit-taking. The more important signal is that the stock is now trading near the middle of its recent range, with the market watching whether buyers can defend the lower band while momentum cools.
Trend & Price Action
The trend backdrop remains positive because the price is above the SMA20 and SMA50, and the SMA20 slope is rising at 0.40% over five days. That matters because a rising short-term average usually means recent buying pressure has been strong enough to keep pullbacks orderly. There is no fresh MA-cross, so this is not a new breakout signal from the moving averages; instead, it is a continuation setup that still needs confirmation from price behavior around resistance.
The Bollinger Band structure adds a more nuanced message. The bands are relatively tight, with a 4.6% width, which suggests a squeeze and therefore a market that may be storing energy for a larger move. The price is at 55% of the 20-day range and sits below the upper band at 32.27, so it is not stretched into overbought territory. That positioning usually means the market has room to move either way, but direction will depend on whether the next push comes with stronger momentum than today’s fade.
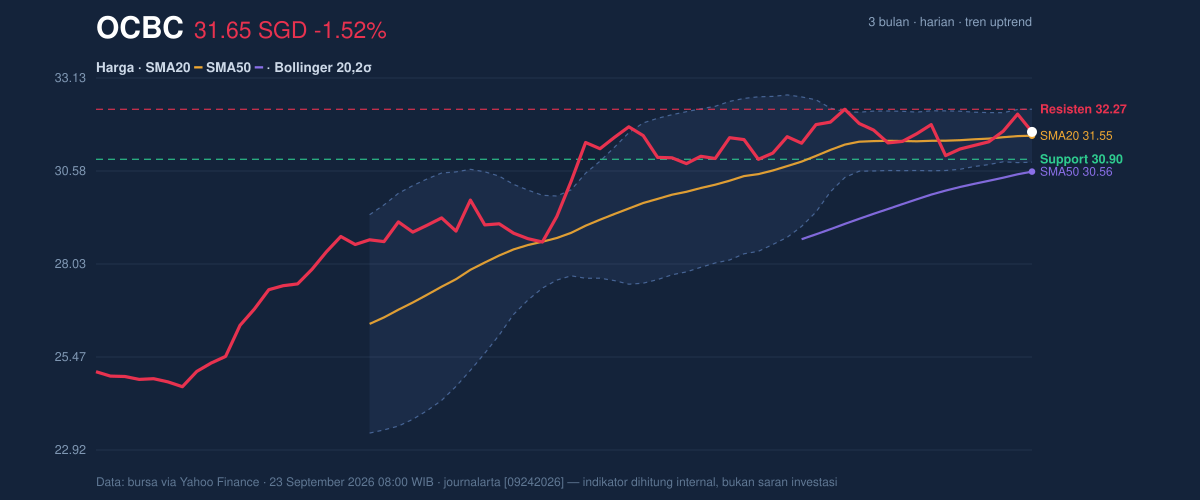
The 3-month range also frames the current setup well. OCBC is trading below the 3-month high of 32.57, yet well above the 3-month low of 24.65. In plain terms, the stock has already repaired much of the earlier weakness, but it has not yet proved it can clear the top of the recent range decisively.
Oscillators & Momentum
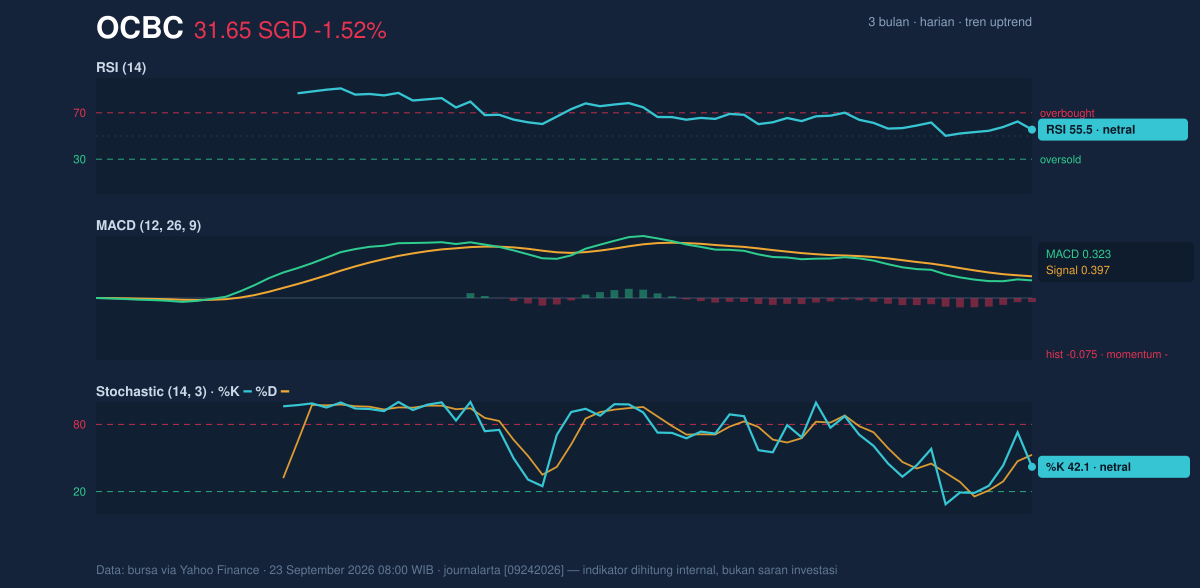
Momentum indicators are more cautious than the trend indicators. The RSI at 55.5 is neutral, which usually means the stock is neither overheated nor washed out. That matters because it leaves room for continuation, but it also shows there is no strong momentum thrust behind the latest price. The Stochastic %K at 42.1 and %D at 52.8 is also neutral, with %K below %D, a configuration that often reflects short-term cooling rather than immediate acceleration.
The clearest warning comes from the MACD at 0.323, which sits below its signal line at 0.397, leaving a histogram of -0.075. In simple language, MACD is still positive in absolute terms, but the recent pace of gains has weakened. That negative histogram does not automatically mean a trend reversal, yet it does suggest the rally is pausing and that follow-through buying has slowed. When MACD softens while price remains above the moving averages, the usual message is consolidation first, direction later.
Volatility & Volume
Volatility is moderate, with ATR(14) at 0.51, equal to 1.6% of price. That points to normal daily movement rather than panic trading. Combined with the Bollinger squeeze, it implies the next meaningful move may come from compression rather than wide swings already underway.
Volume is doing enough to keep the move credible, but not enough to call it emphatic. Last turnover of 6,111,700 shares was only about 1.0x normal versus the 20-day average of 5,949,242. That means today’s pullback was not driven by a dramatic surge in selling. More importantly, OBV is rising, which suggests accumulated buying interest has not disappeared. In technical terms, OBV measures whether volume is generally flowing into the stock or out of it; a rising line alongside an uptrend often indicates that dips are still being absorbed.
Key Levels & Scenarios
The immediate map is straightforward. Support at 30.90 is the first line where buyers have recently shown up, while resistance at 32.27 coincides with the upper Bollinger Band and therefore carries extra technical weight. If the stock can reclaim and hold above 32.27, the squeeze structure would start to favor an expansion move, because price would be pushing into the top of the current range with room to test the 3-month high of 32.57. If instead it loses 30.90, the current uptrend would look less stable, and the market would likely revisit the lower band near 30.82 and the SMA20 at 31.55 as reference points.
Technical Verdict: HOLD (wait & see)
HOLD (wait & see)
- Trend remains positive: price is above the SMA20 and SMA50, with the short-term average still rising.
- Momentum is mixed: RSI 55.5 and Stochastic are neutral, while MACD is below signal and the histogram is negative.
- Volatility is compressed: the Bollinger Band squeeze suggests a move may be coming, but direction is not yet confirmed.
Verdict invalidated if price breaks below 30.90.
- Ideal Entry Range: 30.90 to 31.55
- Exit Target: 32.27 to 32.57
- Stop Loss protection: below 30.90
For non-traders, this means OCBC still looks technically healthy, but the stock has not yet proved that the next move will be upward rather than another pause. The next scheduled test is whether price can clear 32.27 after the current squeeze.
Summary Data OCBC
| Last price | 31.65 SGD |
| Change 1 day / 5 days / 1 month | -1.52% / 1.51% / 0.67% |
| Trend / MA-cross | uptrend / none |
| SMA20 / SMA50 | 31.55 / 30.56 |
| RSI (14) / Stochastic %K | 55.5 / 42.1 |
| Bollinger %B / ATR | 57% / 0.51 |
| Support / Resistance 20 days | 30.90 / 32.27 |
| Data as of | 23 September 2026 08:00 WIB |

