UOB Testing Key Resistance: Stock Gains 0.09% (September 24, 2026)
On September 24, 2026: price 42.84 SGD, trend sideways, RSI 60.9, support 40.64, resistance 42.84. technical analysis of uob stock. UOB Testing Key Resistance…

United Overseas Bank’s Singapore-listed shares edged to SGD 42.84 on Tuesday morning, just above the previous close of SGD 42.80, as the stock pressed against the top of its recent trading band on the SGX. The move matters less for the size of the gain than for its location: UOB is now trading above both short- and medium-term averages, but it is doing so with momentum that is no longer uniformly calm, which often signals a market in the process of deciding whether to extend the move or pause.
Trend & Price Action
As shown in the chart, UOB remains in a sideways trend, but the slope of the SMA20 is 0.95% over 5 days, which tells investors the stock has been leaning upward even if the broader pattern has not yet turned decisively directional. The share price is sitting above the SMA20 at 41.65 and also above the SMA50 at 42.13, a constructive setup because price above both averages usually means recent buyers have been willing to pay up faster than the longer-term trend has been able to pull it back.
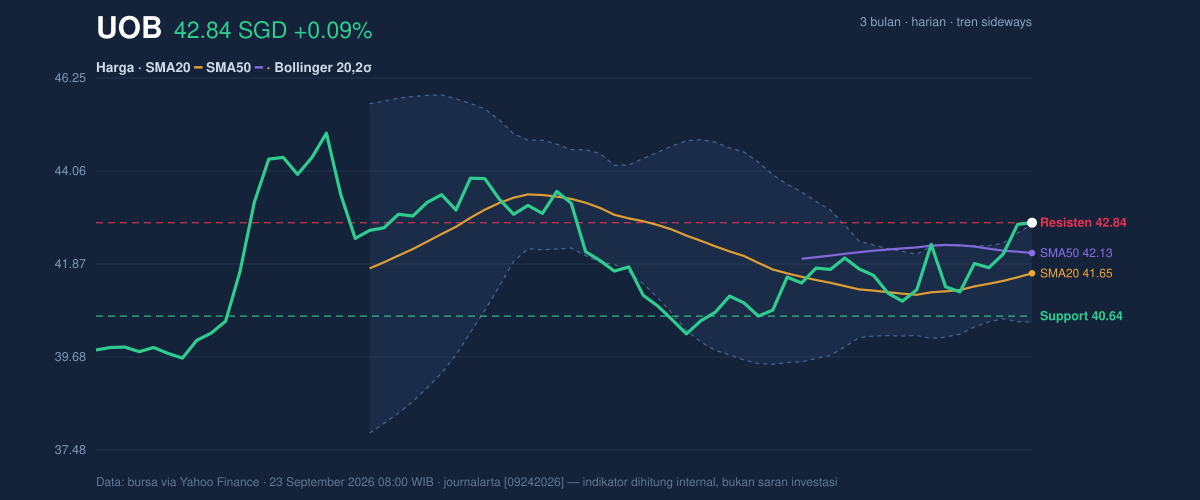
The lack of a fresh MA-cross suggests this is not a brand-new trend shift, but rather a continuation phase. That distinction matters. A new cross often marks a change in market character; the absence of one means the current move is still being tested, and the stock is relying more on follow-through buying than on a clean technical reset. UOB is also trading at the very top of its 20-hour range at 42.84, with support at 40.64, which means the market is currently pricing in strength rather than hesitation. The stock is only a little below its 3-month high of 45.15 and comfortably above the 3-month low of 39.42, so the broader range still leaves room for movement in either direction.
The Bollinger Band picture adds another layer. With the upper band at 42.80, the middle at 41.65 and the lower at 40.50, UOB is trading slightly beyond the upper envelope, with %B at 102%. In plain terms, the price is not just near the top of the band; it is pushing past it, which often reflects short-term enthusiasm. The fact that the band width is only 5.5% and is narrowing is important too: tighter bands usually indicate a squeeze, a period when volatility compresses before a larger move. That does not guarantee direction, but it does mean the stock may be storing energy for a sharper break.
Oscillators & Momentum
The momentum tools are more mixed than the trend tools, and that combination is often where the most useful signal sits. RSI at 60.9 is still neutral, which means the stock is not yet in the classic overbought zone even after recent gains. That is a sign the advance has not become stretched from a broad momentum perspective. But the Stochastic %K at 80.6 and %D at 77.2 are already in overbought territory, which suggests the short-term pace of buying has been fast enough that the stock may need to consolidate before it can climb further.
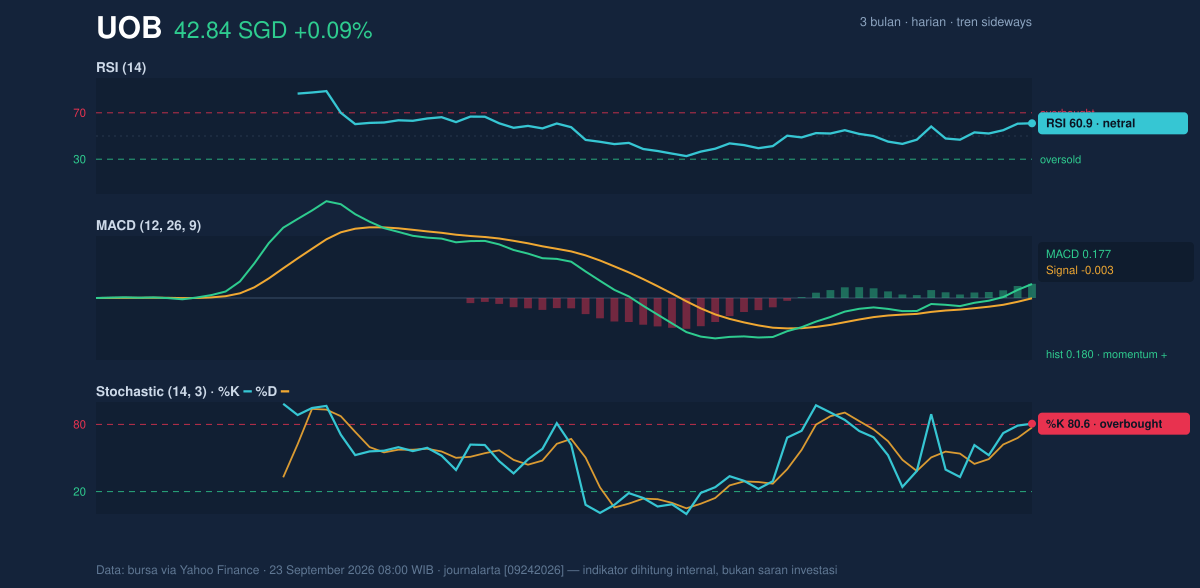
The MACD at 0.177, above its signal line at -0.003 with a histogram of 0.180, is the clearest bullish element in the setup. MACD above signal means upward momentum is still in force, and the positive histogram shows that this momentum is not just present but still expanding. Put differently, the stock has not merely bounced; it has been gaining traction. The tension, however, is that the fast oscillators are already hot while the broader momentum gauge is still supportive, which often precedes either a brief pause or a breakout attempt.
Volatility & Volume
Volume reinforces the idea that the latest move has participation behind it. The most recent turnover of 3,622,800 shares is about 1.2× normal versus the 20-hour average of 3,080,043, and OBV is rising. That combination matters because a price move on heavier-than-usual trading is more credible than one built on thin activity. Rising OBV, or on-balance volume, means cumulative volume has been leaning in the direction of the advance, a sign that buyers have been willing to commit rather than simply probe.
ATR at 0.74, or 1.7% of price, points to moderate volatility. This is not a quiet stock, but it is also not behaving like a disorderly one. In the context of the narrow Bollinger squeeze, moderate ATR can be read as a market that has room to expand without already being in a full-blown spike. That is often where breakouts either start or fail.
Key Levels & Scenarios
The immediate technical ceiling is the current resistance at 42.84, which is being tested right now. If UOB can hold above that area on sustained volume, the chart would be suggesting that the upper Bollinger edge is no longer a cap but a launch point. If it cannot, the stock may drift back toward the SMA20 at 41.65, which is the first meaningful pivot where recent buyers would likely be reassessed.
The lower marker to watch is 40.64 support. A break below that level would weaken the current structure because it would put price back under the recent range floor and closer to the lower Bollinger band at 40.50. That would also challenge the idea that the recent rise is being supported by sustained demand rather than short-covering or brief momentum chasing.
Technical Verdict: HOLD (wait & see)
HOLD (wait & see)
- MACD remains positive, which supports the current upward bias.
- Price is above SMA20 and SMA50, showing the stock is still trading with constructive structure.
- Stochastic is overbought and price is already at the top of the 20-hour range, so the setup looks extended in the short term even though trend support is intact.
Verdict invalidated if price falls below 40.64, because that would break the nearest support and weaken the current squeeze-and-breakout structure.
- Ideal entry range: 41.65 to 42.13
- Exit target: 42.84, with extension only if price can hold above current resistance
- Stop loss protection: 40.64
In plain English: the chart still leans positive, but it is already close to a short-term pressure point, so the next move matters more than the last one.
Summary Data UOB
| Last price | 42.84 SGD |
| Change 1 day / 5 days / 1 month | 0.09% / 3.96% / 4.62% |
| Trend / MA-cross | sideways / none |
| SMA20 / SMA50 | 41.65 / 42.13 |
| RSI (14) / Stochastic %K | 60.9 / 80.6 |
| Bollinger %B / ATR | 102% / 0.74 |
| Support / Resistance 20 days | 40.64 / 42.84 |
| Data as of | 23 September 2026 08:00 WIB |


