Netflix (NFLX) Stock Falls 1.76% on Tuesday, Down 13.1% in a Month
Technical analysis of NFLX stock on November 17, 2026: price 59.68 USD, trend downtrend, RSI 33.0, support 59.68, resistance 67.05.
Why NFLX is in focus today
- Closed at a 20-day low (59.68)
- Trading near its 3-month low (59.41)
- MACD histogram has just turned negative
- Downtrend extending (5-day change -5.66%)
- Not covered by JournalArta in the last 14 days
Selected automatically from 100 NASDAQ (US) stocks by a technical-signal score with daily weighted randomisation — not a recommendation.
Trend & Price Action
The structural picture is unambiguously bearish. At $59.68, Netflix trades below its 20-day average of $63.43 and well below its 50-day average of $68.49, and the 20-day average itself is falling — it declined 3.24% over the past five days. That is the moving average losing ground, not the share price, and it tells you the trend is being repriced lower rather than merely fluctuating. No fresh moving-average cross has formed, but none is needed to confirm direction: the 20-day average already sits beneath the 50-day average, the classic signature of a downtrend in force.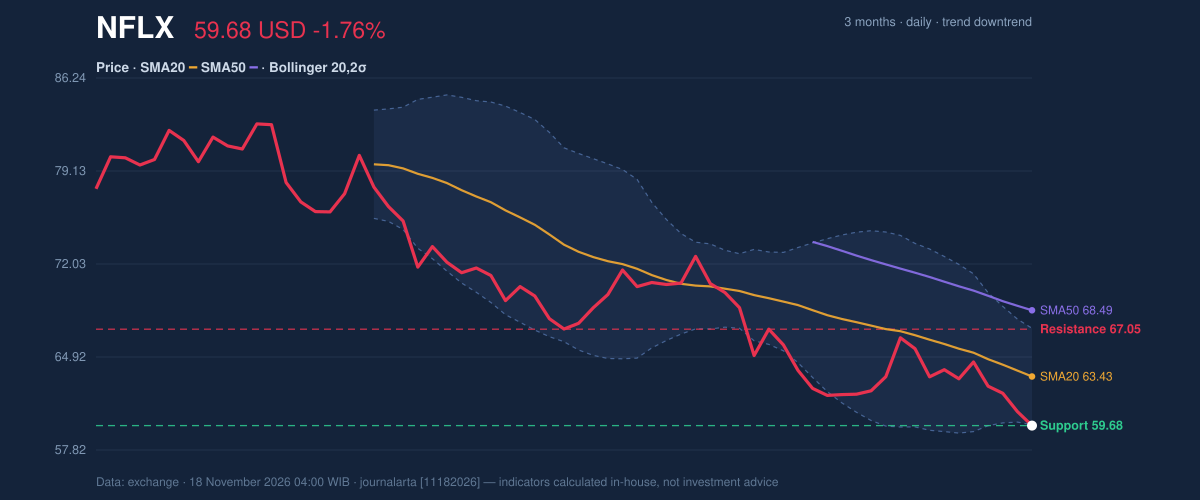
Oscillators & Momentum
Momentum is negative but internally conflicted. The MACD line at -2.062 sits below its signal at -1.987, and the histogram at -0.075 has just turned negative — a fresh bearish inflection rather than an entrenched one. RSI(14) at 33.0 is technically in neutral territory but close enough to the 30 threshold that it is effectively flagging weakness without yet declaring capitulation. The Stochastic, by contrast, is deeply oversold: %K at 3.3 against %D at 6.6.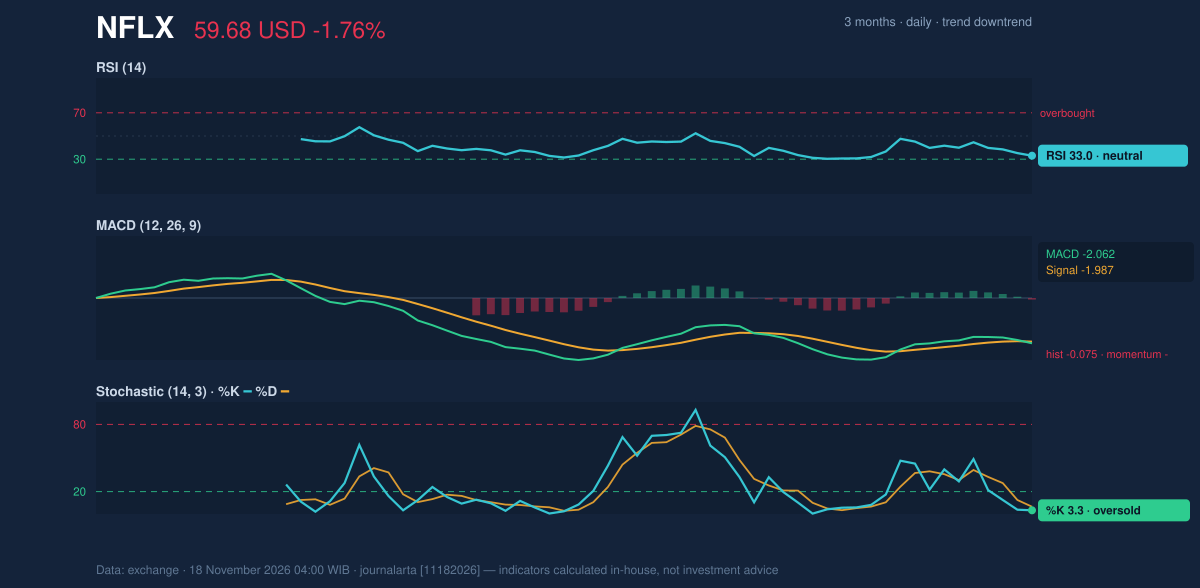
Volatility & Volume
ATR(14) of $1.86 works out to 3.1% of the share price — moderate volatility, meaning the daily swing is meaningful but not disorderly. Volume on the latest session was 34.88 million shares, just 0.8× the 20-day average of 44.27 million, so the decline to new lows is not being driven by heavy institutional exit. That is a thin-volume breakdown, and thin breakdowns can retrace. But the on-balance volume line is falling, which means what participation there is tilts toward sellers. The bears are not sprinting; they are simply winning. Weighing the technical signals, the balance is lopsided: zero bullish signals against two bearish ones — the MACD histogram's negative turn and the falling OBV. There is nothing on the bullish side of the ledger to offset that.Fundamental Context
The technical weakness sits alongside a business that is still expanding. Netflix reported quarterly revenue of $12.87 billion for the quarter ended September 30, 2026, up 11.8% from $11.51 billion a year earlier, according to its SEC filing. Net income came in at $3.66 billion versus $2.55 billion a year prior, with diluted earnings per share of $0.87. The market is evidently looking past that growth — the 13.12% monthly decline occurred despite it — which is itself a signal: when good fundamentals fail to lift a stock, the technical downtrend is doing the talking. The filing offers context, not a counterweight to the chart.Key Levels & Scenarios
The immediate support is the current price itself: $59.68, the 20-day range floor and a hair above the three-month low of $59.41. If that base fails, the stock has no technical floor nearby until the next round-number level, and the downtrend extends. Resistance sits at $67.05 at the top of the 20-day range, with the 20-day average at $63.43 as an intermediate barometer. A recovery above $63.43 — the Bollinger midpoint — would be the first meaningful sign of stabilization; anything short of that leaves the structure intact.Technical Verdict: SELL
The research call is SELL, scored -76 on a -100 to +100 scale, driven by price below its 50-day average, zero bullish versus two bearish technical signals, the 20-day average beneath the 50-day, and a confirmed downtrend. Three factors carry the case: the falling 20-day average (-3.24% over five days) shows trend, not noise; the MACD histogram's negative turn is fresh bearish confirmation; and the falling OBV confirms sellers are in control of participation. - Sell zone: $59.68 – $61.07 - Target 1: $54.93 - Target 2: $50.17 - Stop loss: $62.85 - Reward/risk: 1.5 / 3.0 - Valid until: December 16, 2026 The verdict is invalidated if price breaks and holds above $62.85, which would put the shares back above the lower Bollinger band and near the 20-day average. The deep Stochastic reading at %K 3.3 is the principal risk to the call, since it raises the odds of a sharp counter-trend bounce. In plain terms: the trend is down, the stock is at the bottom of its range, and the setup favors further weakness over a durable turn. The next scheduled catalyst is the company's quarterly reporting calendar, with the December 16 validity window framing the setup until then. *This is technical analysis based on exchange and filing data, not investment advice. Price levels are reference points, not recommendations.*Summary Data NFLX
| Last price | 59.68 USD |
| Change 1 day / 5 days / 1 month | -1.76% / -5.66% / -13.12% |
| Trend / MA-cross | downtrend / none |
| SMA20 / SMA50 | 63.43 / 68.49 |
| RSI (14) / Stochastic %K | 33.0 / 3.3 |
| Bollinger %B / ATR | -1% / 1.86 |
| Support / Resistance 20 days | 59.68 / 67.05 |
| Data as of | 18 November 2026 04:00 WIB |
| JournalArta research verdict (score) | Sell (-76) |
| Sell zone | 59.68 – 61.07 |
| Target 1 / 2 | 54.93 / 50.17 |
| Stop loss | 62.85 |
| Reward/risk | 1.5 / 3.0 |
Today's full Buy and Sell list for US stocks →
Disclaimer: This technical analysis is generated automatically from exchange data and indicators calculated by JournalArta, for information and education only. The verdict and the entry, target and stop-loss levels are not investment advice or a solicitation to buy or sell any security. Investment decisions and their risks rest solely with the reader.
Track NFLX stock price daily: live levels, support/resistance and our full NFLX analysis history.
 Take the quizWhat Kind of Holiday Spender Are You? Take the Black Friday QuizStart →
- 1U.S. Emergency Alert Test Nov. 17 Is Not a Power Outage

- 2DUP Chairman Lord Morrow Loses Wife and Daughter Within Hours in NI

- 3NASA’s Curiosity Rover Burst Open a Rock and Found Pure Sulfur

- 4Women With Autoimmune Diseases Wait About 4 Years for Diagnosis, Study Finds

- 5Stock Market Today: Dow Futures Slip as Nasdaq Futures Climb Before Earnings

 Lifestyle · Food & Health4 Reasons to Eat Oatmeal, According to Nutrition Experts
 Lifestyle7 Signs Your Social Battery Is Running Low (and Why You Keep Cancelling Plans)
 Lifestyle · Food & HealthThanksgiving Food Safety: How Long Leftovers Last and the Safe Turkey Temperature
 Lifestyle7 Quiet Habits of Emotionally Intelligent People, According to Psychologists