Coinbase (COIN) Stock on Tuesday: Slides 4.02%, Down 32.7% in a Month
Technical analysis of COIN stock on November 17, 2026: price 115.02 USD, trend downtrend, RSI 28.0, support 115.02, resistance 177.08.

Why COIN is in focus today
- Trading near its 3-month low (114.11)
- RSI(14) at 28.0 — oversold zone
- Downtrend extending (5-day change -12.95%)
- Not covered by JournalArta in the last 14 days
Selected automatically from 100 NASDAQ (US) stocks by a technical-signal score with daily weighted randomisation — not a recommendation.
Trend & Price Action
The trend is unambiguously down. The 20-day average sits at $145.09 and the 50-day average at $167.81, with the price below both, and the 20-day average fell 7.63% over five trading days — a steep slope that confirms sellers remain in control. No new moving-average cross formed, meaning the bearish alignment was already in place rather than freshly triggered. The stock is trading at 0% of its 20-day range, the hard bottom, with resistance far overhead at $177.08 and the three-month high of $208.33 well out of reach.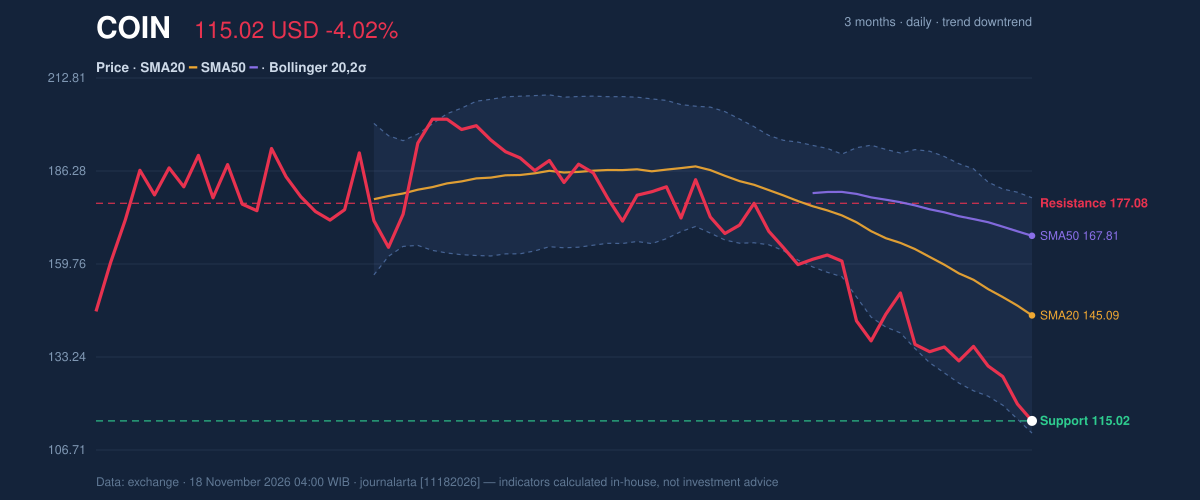
Oscillators & Momentum
Momentum indicators are oversold but not yet reversing. MACD stands at −13.500 against a signal line of −11.334, with the histogram at −2.166 — negative and widening, meaning downward momentum is still accelerating rather than exhausting. The RSI and Stochastic both flag exhaustion of selling pressure, but neither has confirmed a turn; the gap between "oversold" and "turning" is exactly where false bottoms form.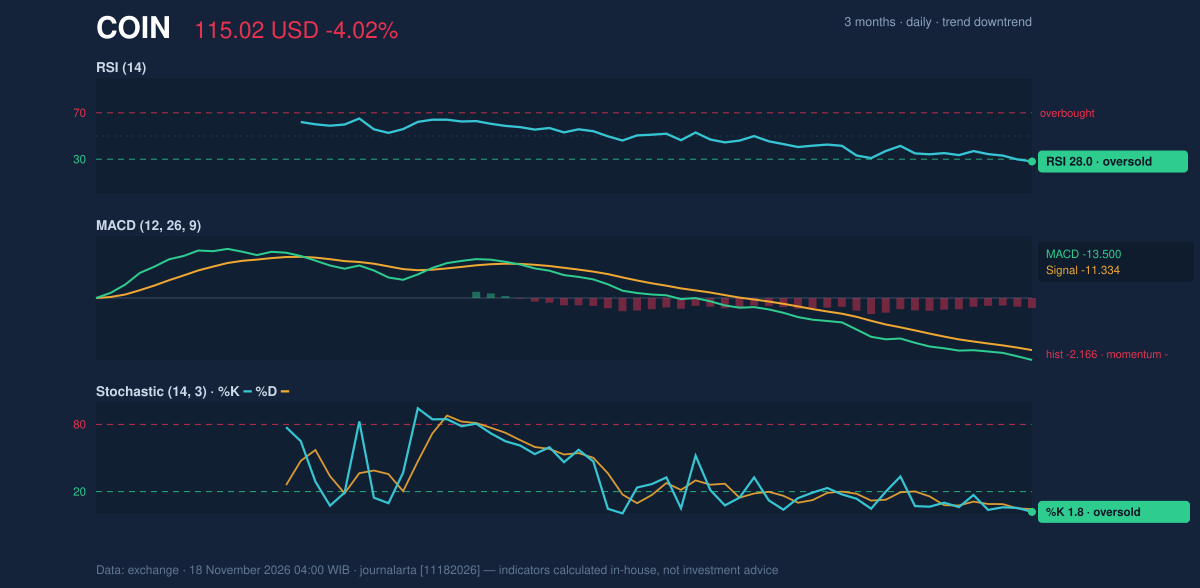
Volatility & Volume
Volatility is elevated. ATR of $10.00 represents 8.7% of the share price, meaning a routine session can swing roughly ten dollars — a wide band for position sizing. On the volume side, 9,177,600 shares changed hands against a 20-day average of 8,598,195, about 1.1 times normal. The extra participation on a down day is not a vote of confidence. The on-balance-volume line is falling, and the data counts that as its one bearish technical signal: a downtrend confirmed by falling OBV. Money is leaving on net, and with zero bullish signals against one bearish, the weight of evidence is stacked on the sell side.Key Levels & Scenarios
The battleground is narrow. Downside: support at $115.02 is effectively the last print, and the three-month low at $114.11 is the real line in the sand. A close below $114.11 would confirm the range breakdown and leave the price−1.5×ATR reference of $100.02 as the next measured zone. Upside: any recovery first has to clear the 20-day resistance at $177.08 to matter, with the price+1.5×ATR reference of $130.02 a nearer marker on the way. A rebound that stalls below $130 would look like a bounce inside a downtrend.Fundamental Context
The technical weakness tracks a softer business backdrop. Coinbase reported quarterly revenue of $1.22 billion for the quarter ended September 30, 2026, down 35.0% from $1.87 billion a year earlier, according to its SEC filing. Net income, however, rose to $718.7 million from $432.6 million, with diluted earnings per share of $2.51, according to the same filing — a reminder that cost discipline can lift the bottom line even as trading activity cools.Technical Verdict: HOLD (wait & see)
The call is HOLD (wait & see) — trend and momentum are not aligned. The JournalArta research score of −58 on a −100 to +100 scale keeps the stock out of Buy territory, with the price below its 50-day average, the 20-day average below the 50-day, and a 12.95% five-day drop all weighing. - Entry range: a confirmed close above the 20-day resistance at $177.08, or, on the downside, stabilization above the 20-day support at $115.02. - Exit target: $130.02 (price + 1.5×ATR) as a first marker toward $177.08. - Stop loss: a close below the three-month low at $114.11 invalidates the setup and opens the $100.02 zone. Put plainly: the stock is oversold and sitting on support, but the trend has not turned, so this is a watch-and-wait situation rather than a break in the downtrend. Price closed at $115.02, just 91 cents above the three-month low.Summary Data COIN
| Last price | 115.02 USD |
| Change 1 day / 5 days / 1 month | -4.02% / -12.95% / -32.68% |
| Trend / MA-cross | downtrend / none |
| SMA20 / SMA50 | 145.09 / 167.81 |
| RSI (14) / Stochastic %K | 28.0 / 1.8 |
| Bollinger %B / ATR | 5% / 10.00 |
| Support / Resistance 20 days | 115.02 / 177.08 |
| Data as of | 18 November 2026 04:00 WIB |
| JournalArta research verdict (score) | Hold (-58) |
Today's full Buy and Sell list for US stocks →
Disclaimer: This technical analysis is generated automatically from exchange data and indicators calculated by JournalArta, for information and education only. The verdict and the entry, target and stop-loss levels are not investment advice or a solicitation to buy or sell any security. Investment decisions and their risks rest solely with the reader.
Track COIN stock price daily: live levels, support/resistance and our full COIN analysis history.
 Take the quizWhat Kind of Holiday Spender Are You? Take the Black Friday QuizStart →
- 1U.S. Emergency Alert Test Nov. 17 Is Not a Power Outage

- 2DUP Chairman Lord Morrow Loses Wife and Daughter Within Hours in NI

- 3NASA’s Curiosity Rover Burst Open a Rock and Found Pure Sulfur

- 4Women With Autoimmune Diseases Wait About 4 Years for Diagnosis, Study Finds

- 5Stock Market Today: Dow Futures Slip as Nasdaq Futures Climb Before Earnings

 Lifestyle · Food & Health4 Reasons to Eat Oatmeal, According to Nutrition Experts
 Lifestyle7 Signs Your Social Battery Is Running Low (and Why You Keep Cancelling Plans)
 Lifestyle · Food & HealthThanksgiving Food Safety: How Long Leftovers Last and the Safe Turkey Temperature
 Lifestyle7 Quiet Habits of Emotionally Intelligent People, According to Psychologists