CrowdStrike (CRWD) Stock Falls 1.63% on Tuesday, Down 2.7% in Five Sessions
Technical analysis of CRWD stock on November 17, 2026: price 219.58 USD, trend downtrend, RSI 38.7, support 216.90, resistance 268.02.

Why CRWD is in focus today
- Downtrend extending (5-day change -2.74%)
Selected automatically from 100 NASDAQ (US) stocks by a technical-signal score with daily weighted randomisation — not a recommendation.
Trend & Price Action
The price structure is defined by a series of lower highs and lower lows since the three-month peak of 286.99. The recent low of 181.24 marks the other end of that range. Against the 20-day reference band, support rests at 216.90 and resistance at 268.02 — a wide corridor, and price is hugging the bottom edge of it.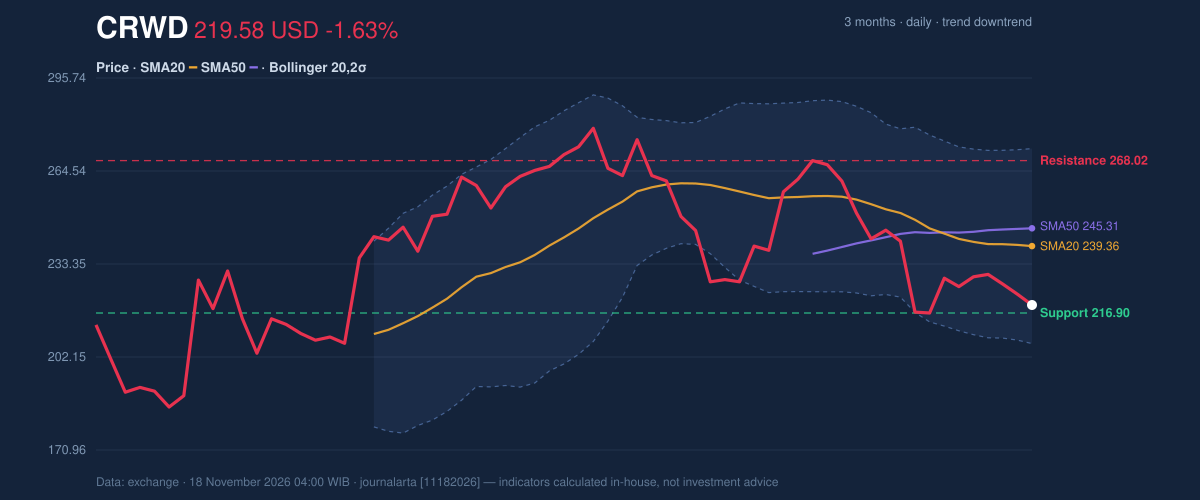
Oscillators & Momentum
Momentum indicators are sending mixed but ultimately bearish messages. The 14-day RSI at 38.7 is neutral — not yet oversold — which means there is no automatic snapback pressure. The stochastic oscillator tells a different story: %K at 11.5 and %D at 17.0 place it firmly in oversold territory, and the %K line below %D hints at continued weakness rather than an imminent cross higher.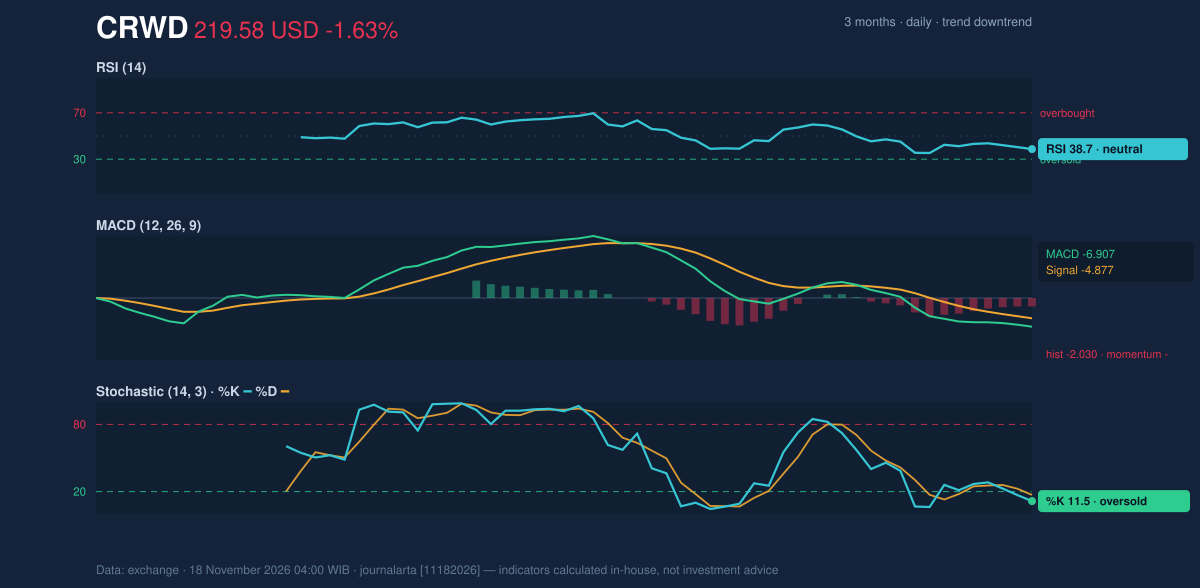
Volatility & Volume
Bollinger Band width at 27.3% is wide and expanding — the bands are not squeezing, they are stretching. That reflects high realized volatility, and %B at 20% puts price in the lower fifth of the band, closer to the lower band at 206.66 than to the midline at 239.36. The ATR of 14.93, equal to 6.8% of the share price, tells traders to expect daily swings of that magnitude; position sizing around this stock requires wider stops than the average large-cap. Volume offers no comfort. The last session traded 7,860,400 shares, just 0.9× the 20-day average of 9,031,590 — thin participation. The on-balance volume line, meanwhile, is falling. Falling OBV on light volume suggests sellers are in control without a capitulation flush; there is no evidence of accumulation absorbing the supply.Fundamentals in Context
The technical weakness sits against a fundamentally improving backdrop. CrowdStrike reported quarterly revenue of $1.47 billion for the quarter ended July 31, 2026, up 25.8% from $1.17 billion a year earlier, and swung to net income of $5.3 million from a net loss of $70.2 million, according to its SEC filing. Diluted earnings per share came in at $0.01. A company growing revenue at that pace while reaching profitability is not deteriorating operationally — which suggests the stock's slide reflects valuation compression or sector rotation rather than a broken business. Markets, however, price the chart in front of them.Key Levels & Scenarios
The immediate battleground is 216.90. A daily close below that support opens the path toward the lower Bollinger band at 206.66, with the three-month low of 181.24 as the next structural reference. Conversely, a reclaim of the 20-day average at 239.36 would be the first genuine sign of stabilization; failure to hold 216.90 would invalidate any bounce thesis. The resistance at 268.02 remains distant and irrelevant until the trend repairs itself.Technical Verdict: SELL
The JournalArta research model scores the stock -76 on a −100 to +100 scale, driven by price below the 50-day average, zero bullish versus two bearish technical signals, the 20-day average below the 50-day, and a confirmed downtrend. - Sell zone: 219.58 – 230.77 - Target 1: 181.50 - Target 2: 143.41 - Stop loss: 244.97 - Reward/risk: 1.5 / 3.0 - Valid until: December 16, 2026 The verdict rests on three pillars: the falling 20-day average (-1.00% over five days) with price below both key averages; a negative and widening MACD histogram at -2.030; and falling OBV with thin volume confirming distribution. The call is invalidated if price breaks above the stop at 244.97, which would place the stock back above its 50-day average. For a non-trader, the read is simple: the chart is still pointing down, and the indicators have not yet shown the kind of exhaustion that typically precedes a durable turn. *This is technical analysis based on exchange data and public filings, not an investment recommendation.*Summary Data CRWD
| Last price | 219.58 USD |
| Change 1 day / 5 days / 1 month | -1.63% / -2.74% / -3.43% |
| Trend / MA-cross | downtrend / none |
| SMA20 / SMA50 | 239.36 / 245.31 |
| RSI (14) / Stochastic %K | 38.7 / 11.5 |
| Bollinger %B / ATR | 20% / 14.93 |
| Support / Resistance 20 days | 216.90 / 268.02 |
| Data as of | 18 November 2026 04:00 WIB |
| JournalArta research verdict (score) | Sell (-76) |
| Sell zone | 219.58 – 230.77 |
| Target 1 / 2 | 181.50 / 143.41 |
| Stop loss | 244.97 |
| Reward/risk | 1.5 / 3.0 |
Today's full Buy and Sell list for US stocks →
Disclaimer: This technical analysis is generated automatically from exchange data and indicators calculated by JournalArta, for information and education only. The verdict and the entry, target and stop-loss levels are not investment advice or a solicitation to buy or sell any security. Investment decisions and their risks rest solely with the reader.
Track CRWD stock price daily: live levels, support/resistance and our full CRWD analysis history.
 Take the quizWhat Kind of Holiday Spender Are You? Take the Black Friday QuizStart →
- 1U.S. Emergency Alert Test Nov. 17 Is Not a Power Outage

- 2DUP Chairman Lord Morrow Loses Wife and Daughter Within Hours in NI

- 3NASA’s Curiosity Rover Burst Open a Rock and Found Pure Sulfur

- 4Women With Autoimmune Diseases Wait About 4 Years for Diagnosis, Study Finds

- 5Stock Market Today: Dow Futures Slip as Nasdaq Futures Climb Before Earnings

 Lifestyle · Food & Health4 Reasons to Eat Oatmeal, According to Nutrition Experts
 Lifestyle7 Signs Your Social Battery Is Running Low (and Why You Keep Cancelling Plans)
 Lifestyle · Food & HealthThanksgiving Food Safety: How Long Leftovers Last and the Safe Turkey Temperature
 Lifestyle7 Quiet Habits of Emotionally Intelligent People, According to Psychologists